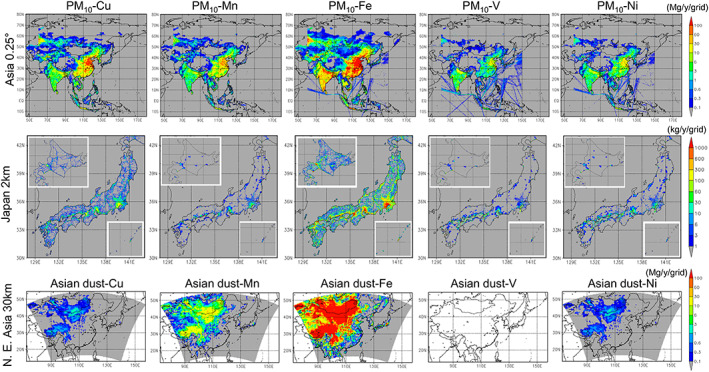
Figure 4.

The spatial distribution of annual total emission fluxes of (left to right) Cu, Mn, Fe, V, and Ni in PM10 of (top to bottom) anthropogenic fluxes in Asia (TMI‐Asia v1.0; 0.25° × 0.25° for the base year 2008; Mg y−1 grid−1), anthropogenic fluxes in Japan (TMI‐Japan v1.0; 2 km × 2 km for the base year 2010; kg y−1 grid−1), and fluxes associated with Asian dust particles over D01 (30 km × 30 km on the Lambert conformal conic projection for the year 2013; Mg y−1 grid−1).
