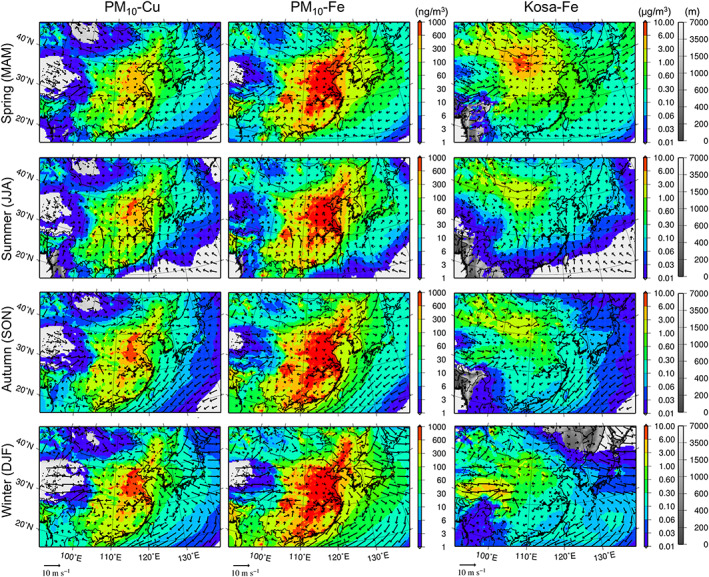
Figure 6.

Seasonal mean surface air concentrations of (left to right) anthropogenic PM10‐Cu, anthropogenic PM10‐Fe, and Fe in Asian dust in (top to bottom) spring, summer, autumn, and winter of 2013 with surface wind vectors over D01. Note that the color bar of Asian dust Fe is one order larger than that for anthropogenic metals. The model terrestrial elevations are depicted under the shades.
