
Figure 7.
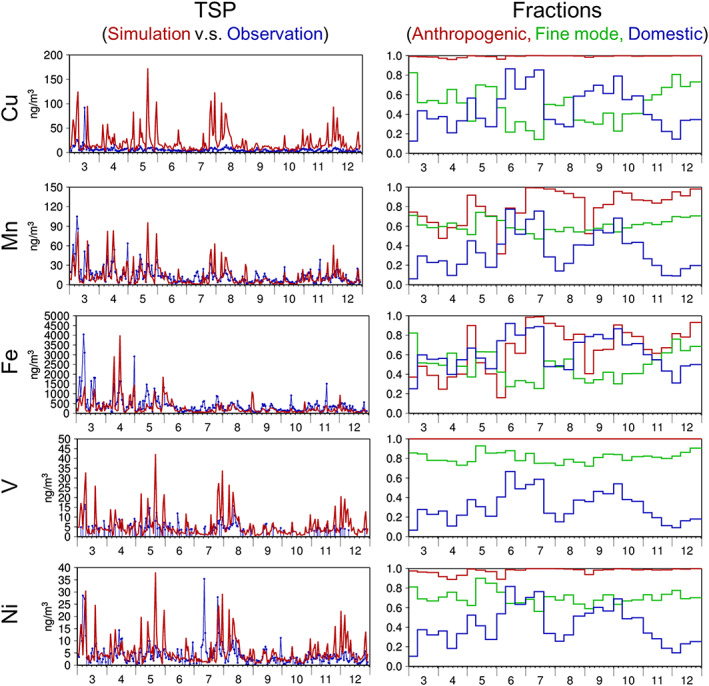
Temporal variations in (left) (red) simulated (D02) and (blue) observed (top to bottom) daily concentrations of Cu, Mn, Fe, V, and Ni in TSP and (right) 10‐day mean simulated (D02) fractions of (red) anthropogenic to total (anthropogenic + Asian dust), (green) anthropogenic fine mode to anthropogenic total (fine + coarse), and (blue) anthropogenic domestic PM10 to anthropogenic total (domestic and transboundary) PM10 at Yonago.