
Figure EV4. Characterisation of Rab GTPase behaviour after sterile damage.
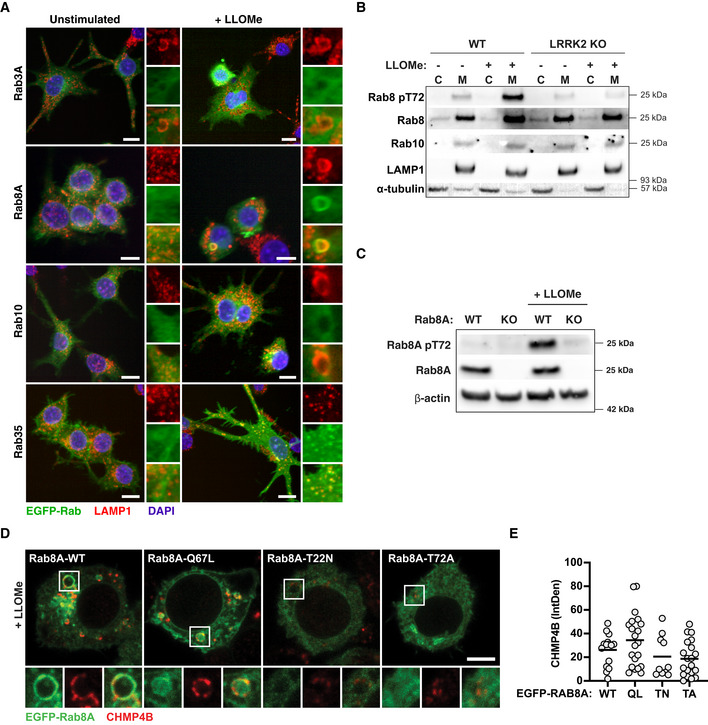
- RAW264.7 macrophages were electroporated with EGFP‐Rab3A, EGFP‐Rab8A, EGFP‐Rab10 and EGFP‐Rab35. Cells were treated with 1 mM of LLOMe for 30 min, and Rab recruitment to LAMP1 + compartments was monitored by high‐content immunofluorescence imaging. Scale bar = 10 μm.
- WT and LRRK2 KO RAW264.7 macrophages were treated with 1 mM LLOMe for 30 min. Cells were separated into cytosolic (C) and membrane (M) fractions and analysed for Rab8A pT72, Rab8A and Rab10 by Western blot.
- WT and Rab8A KO RAW264.7 macrophages were treated with 1 mM LLOMe for 30 min, and Rab8A and Rab8A pT72 levels were analysed by Western blot.
- RAW264.7 macrophages were electroporated with EGFP‐Rab8A‐WT, EGFP‐Rab8A‐Q67L, EGFP‐Rab8A‐T22N and EGFP‐Rab8A‐T72A. Cells were treated with 1 mM of LLOMe for 30 min, and CHMP4B recruitment was assessed by confocal microscopy. Scale bar = 5 μm.
- CHMP4B integrated fluorescence density was analysed per cell. Data show values from single cells and mean.
Source data are available online for this figure.