Figure 2.

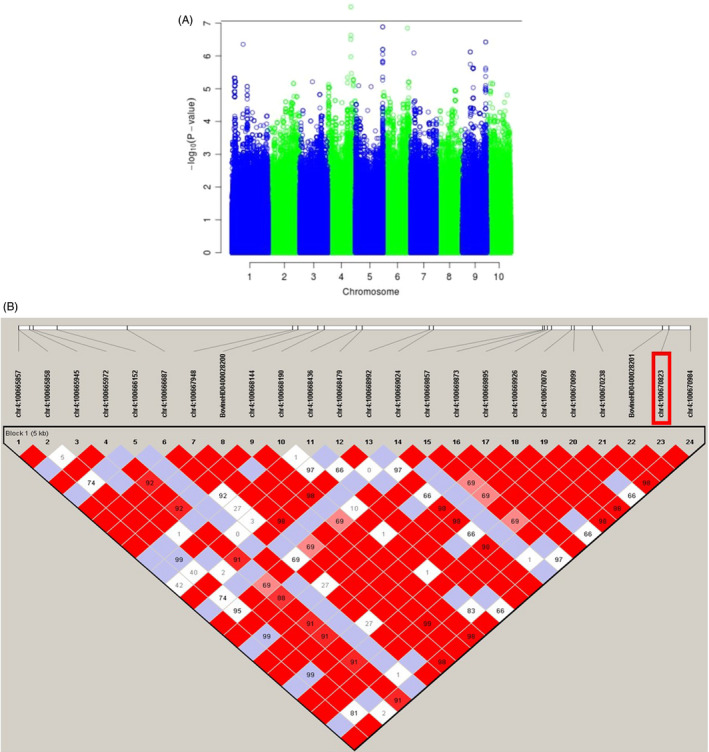
Manhattan plot of ‐log10 (p) for the NMW‐associated segment. A, the threshold is illustrated by a horizontal line. B, LD plot showing a 5‐kb high‐LD block harbouring the most associated SNP in segment 1 of bovine chromosome 4

Manhattan plot of ‐log10 (p) for the NMW‐associated segment. A, the threshold is illustrated by a horizontal line. B, LD plot showing a 5‐kb high‐LD block harbouring the most associated SNP in segment 1 of bovine chromosome 4