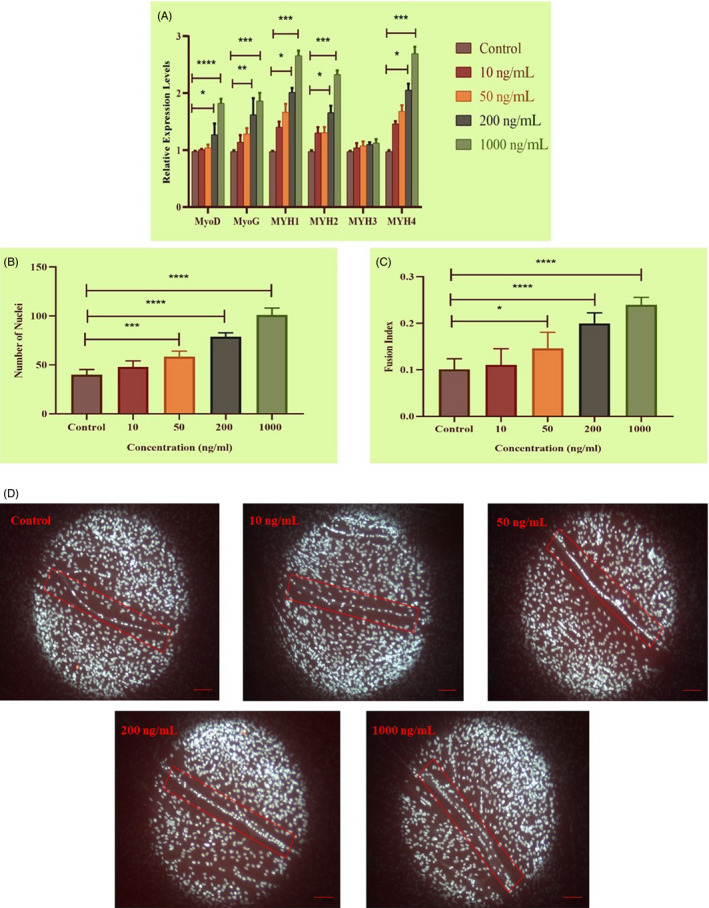
Figure 3.

MTPN promotion of muscle differentiation evidenced by qRT‐PCR, number of nuclei and fusion index. A, Relative mRNA expression levels of MyoD, MyoG, MYH1, MYH2, MYH3, and MYH4 assessed after addition of MTPN (in ng/mL: 10, 50, 200 and 1000) (18s, reference gene). B and C, DAPI‐stained nuclei revealing numbers of nuclei and calculated fusion index values. D, Representative fluorescence images of nuclei within myotubes at indicated concentrations. One‐way and two‐way ANOVAs with Tukey's post hoc testing; ****P < .0001, ***P < .001, **P < .01 and *P < .05
