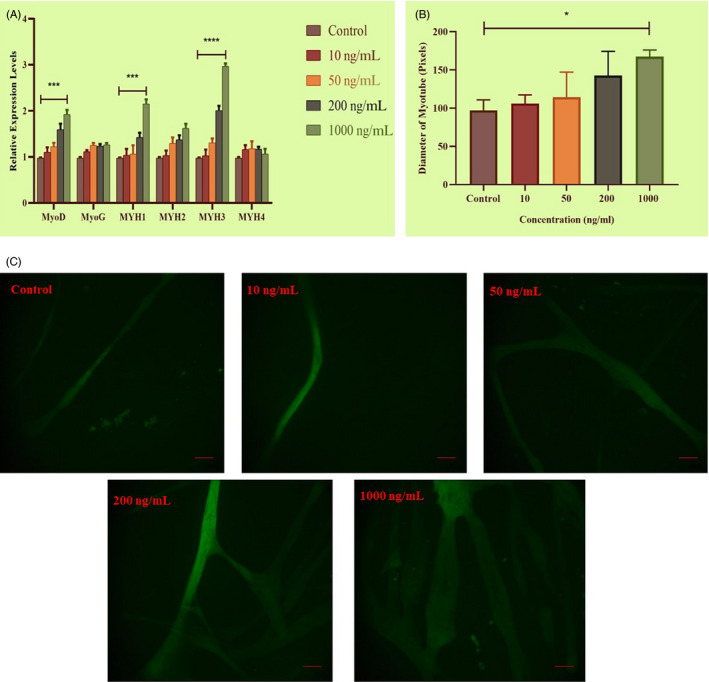
Figure 4.

MTPN‐induced muscle hypertrophy. A, Relative mRNA expression of MyoD, MyoG, MYH1, MYH2, MYH3 and MYH4 assessed after addition of MTPN (in ng/mL: 10, 50, 200 and 1000) demonstrated by qRT‐PCR. B, Comparison of myotube diameters of MTPN treatment groups. C, Representative images showing the morphology of MyHC‐immunolabelled myotubes (green). One‐way and two‐way ANOVAs with Tukey's post hoc testing; ****P < .0001, ***P < .001, **P < .01 and *P < .05
