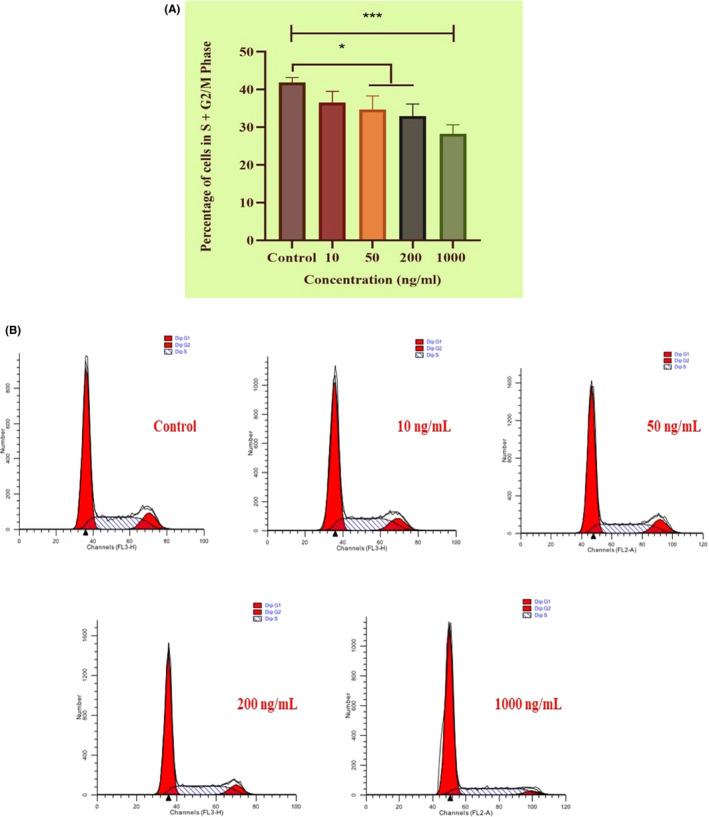
Figure 6.

Flow cytometry data showing MTPN‐induced reductions in proliferating cell percentages. A, mean percentages (±SDs) of cells in S and G2/M phase following treatment with indicated experimental doses of MTPN from three independent experiments. B, Phase comparisons depicted by flow cytometry profiles. One‐way ANOVAs with Tukey's post hoc testing; ****P < .0001, *P < .05
