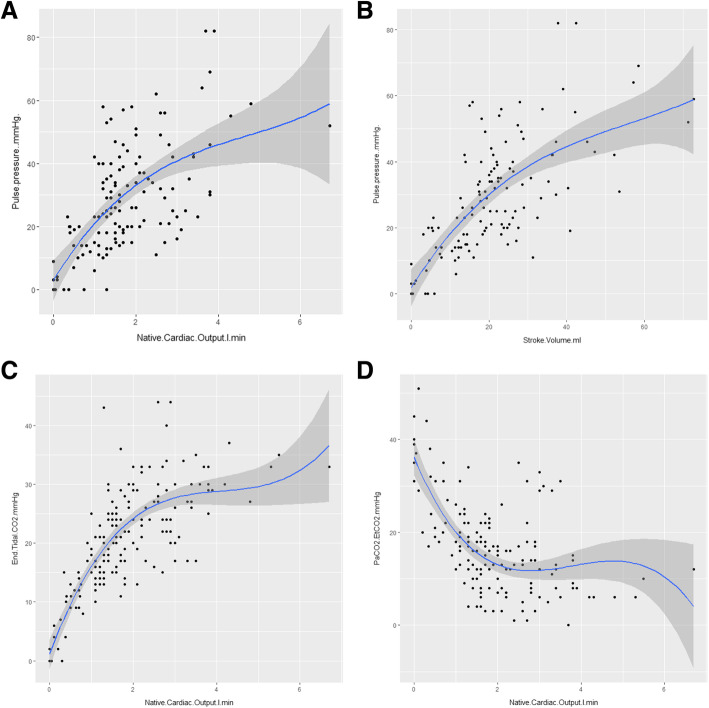
Fig. 2.
Pulse pressure and EtCO2 relationships with native cardiac output and their determinants. Native cardiac output was assessed with pulmonary artery catheter or echocardiography at the same time as pulse pressure, end-tidal carbon dioxide (EtCO2), arterial carbon dioxide pressure (PaCO2), and heart rate. Figures consist of spline regression representations (cubic spline, P Bruce and Bruce 2017) of the relationships between a pulse pressure and native cardiac output, b pulse pressure and stroke volume, c EtCO2 and native cardiac output, and d PaCO2-EtCO2 gradient and native cardiac output. The variation of model performance according to the X was evaluated through prediction of the error model (p < 0.001, p < 0.001, p = 0.01, and p = 0.3 for figures a, b, c, and d respectively)

