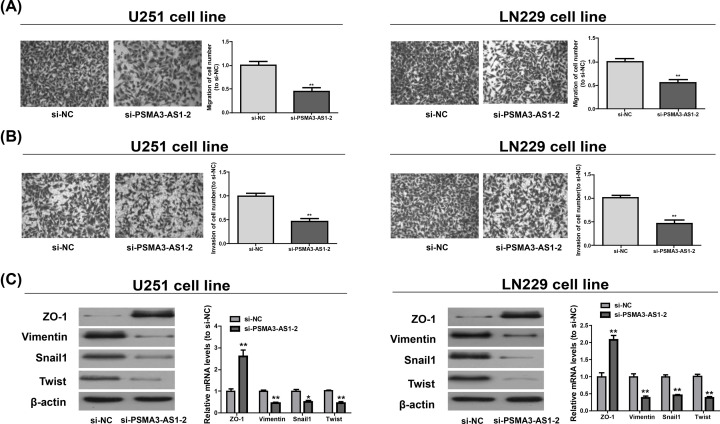
Figure 3. Regulation of PSMA3-AS1 on the migration and invasion of LN229 and U251.
(A,B) The percentage of cell suffering from migration and invasion number in LN229 and U251 after si-PSMA3-AS1-2 transfection is detected. (C) The protein and mRNA levels of ZO-1, Vimentin, Snail1 and Twist in LN229 and U251 upon down-expression of PSMA3-AS1. Three independent experiments are conducted. Error bars represent mean ± SD of at least triplicate experiments. *P<0.05; **P<0.01.

