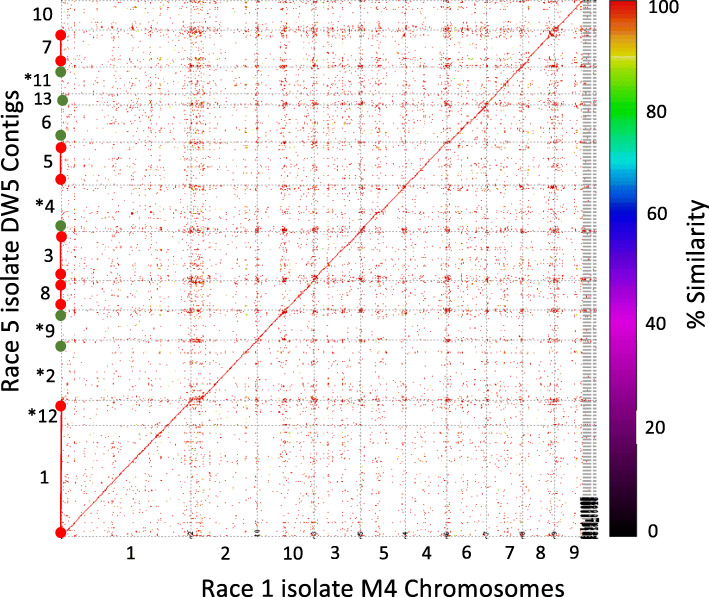
Fig. 1.
Ptr nucleotide sequence alignment for race 5 isolate DW5 contigs (vertical axis) to race 1 M4 chromosomes (horizontal axis). The sequence dot plot shows the percent sequence similarity between the two genomes. The diagonal red line is the maximal colinear alignment between the two genomes. Individual contigs and chromosomes are delineated by grey lines in both axes of the sequence dot plot. *DW5 contigs are reverse complemented. On the vertical axis, DW5 contigs that represent chromosomes are informed by telomere repeat motifs, single (green circle) and both (red circles connected by a red bar)

