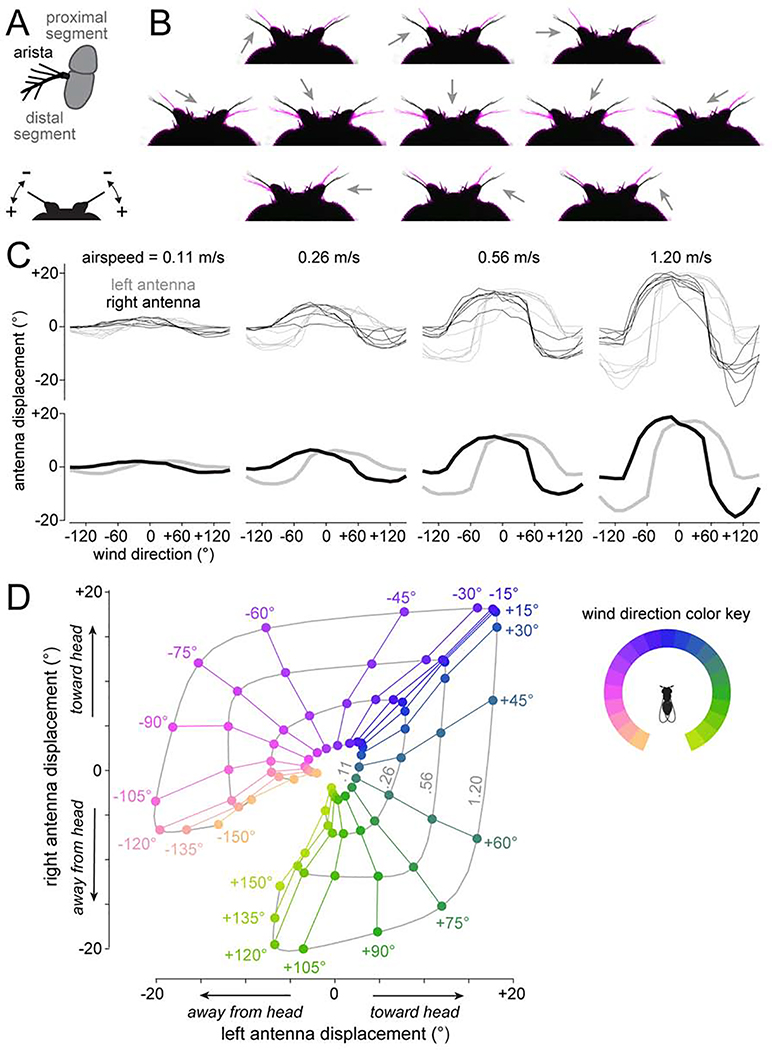
Figure 4: Antennal mechanics are nonlinearly sensitive to lateral wind directions.
(A) Top: schematic of the arista and antenna in frontal-medial view. Wind exerts force on the arista and rotates the distal antennal segment relative to the proximal segment. Bottom: schematic of the head in dorsal view. Wind can push the antenna toward (+) or away from the head (−).
(B) Dorsal view of the antennae with resting position in black, and wind-induced positions in magenta. Arrows are wind direction (wind speed: 1.20 m/s).
(C) Antennal displacements as a function of wind direction and wind speed. Top: individual flies. Bottom: mean across flies.
(D) Data from one fly in (C), displayed as trajectories in 2-D displacement space. In this plot, we pooled mirror-reflected data from the left and right to generate a symmetric map. Data points are color-coded by wind direction. Displacements measured at the same wind speed are connected, with the corresponding wind speeds (m/s) in gray type.

