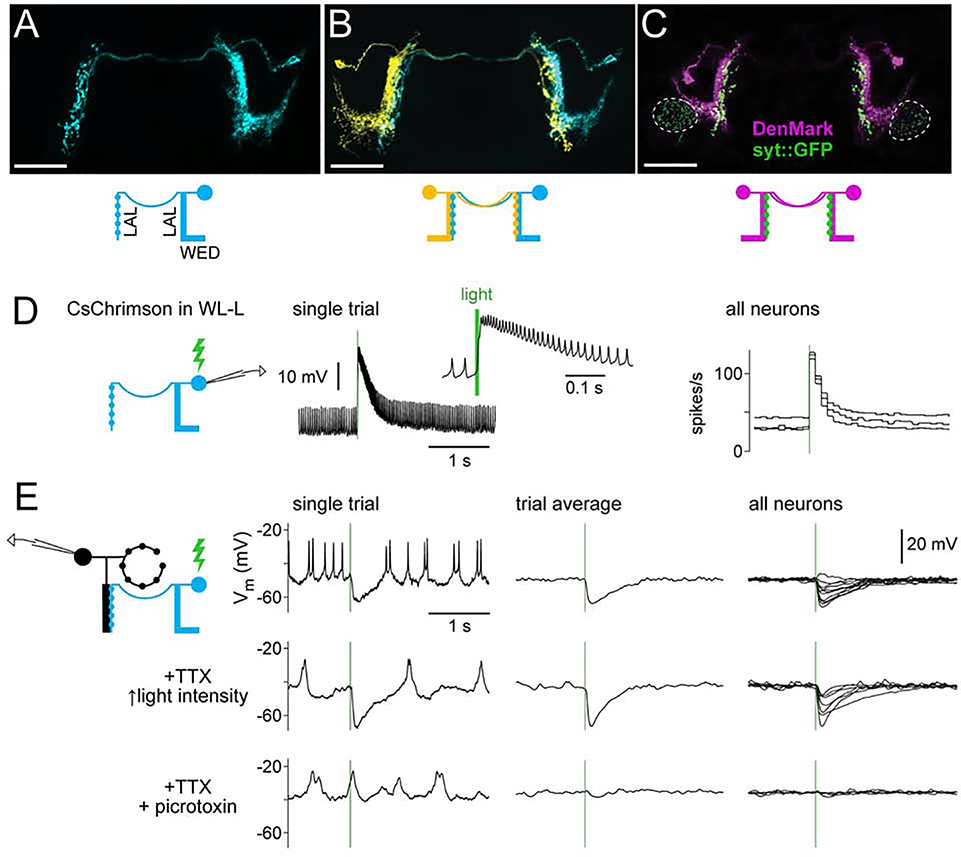
Figure 7: R1 neurons receive direct GABAergic inhibition from WL-L neurons.
(A) MCFO labeling of an WL-L neuron, showing smooth neurites in the ipsilateral WED and ipsilateral LAL, and boutons in the contralateral LAL. Scale bars in (A-C) are 50 μm.
(B) Two-color MCFO labeling of two WL-L neurons in the same brain. Note that each cell’s bouton-rich arbor is just medial to the smooth arbor of the contralateral cell.
(C) Polarity markers expressed in WL-L neurons. The dendritic marker DenMark localizes to smooth arbors, whereas synaptotagmin::GFP localizes to bouton-rich arbors. Dashed lines indicate synaptotagmin::GFP in another cell type in the same Gal4 line (not WL-L).
(D) Recording from a CsChrimson+ WL-L neuron. Left: light-evoked response in an example trial (enlarged in inset). Right: firing rates in 3 neurons (in 3 flies). Green bars indicate 10-ms light pulses.
(E) Recording from R1 neurons while activating WL-L neurons. Responses were recorded first without antagonists, then in 1 μM TTX, and then after adding 5 μM picrotoxin (retaining TTX). Stimulus intensity was increased after adding TTX, to compensate for decreased excitability of presynaptic terminals. Left: single-trial responses from one neuron. Middle: trial-averaged responses for the same neuron. Right: trial-averaged responses for all neurons (n=11, 7, 4 neurons for the top, middle, and bottom rows).

