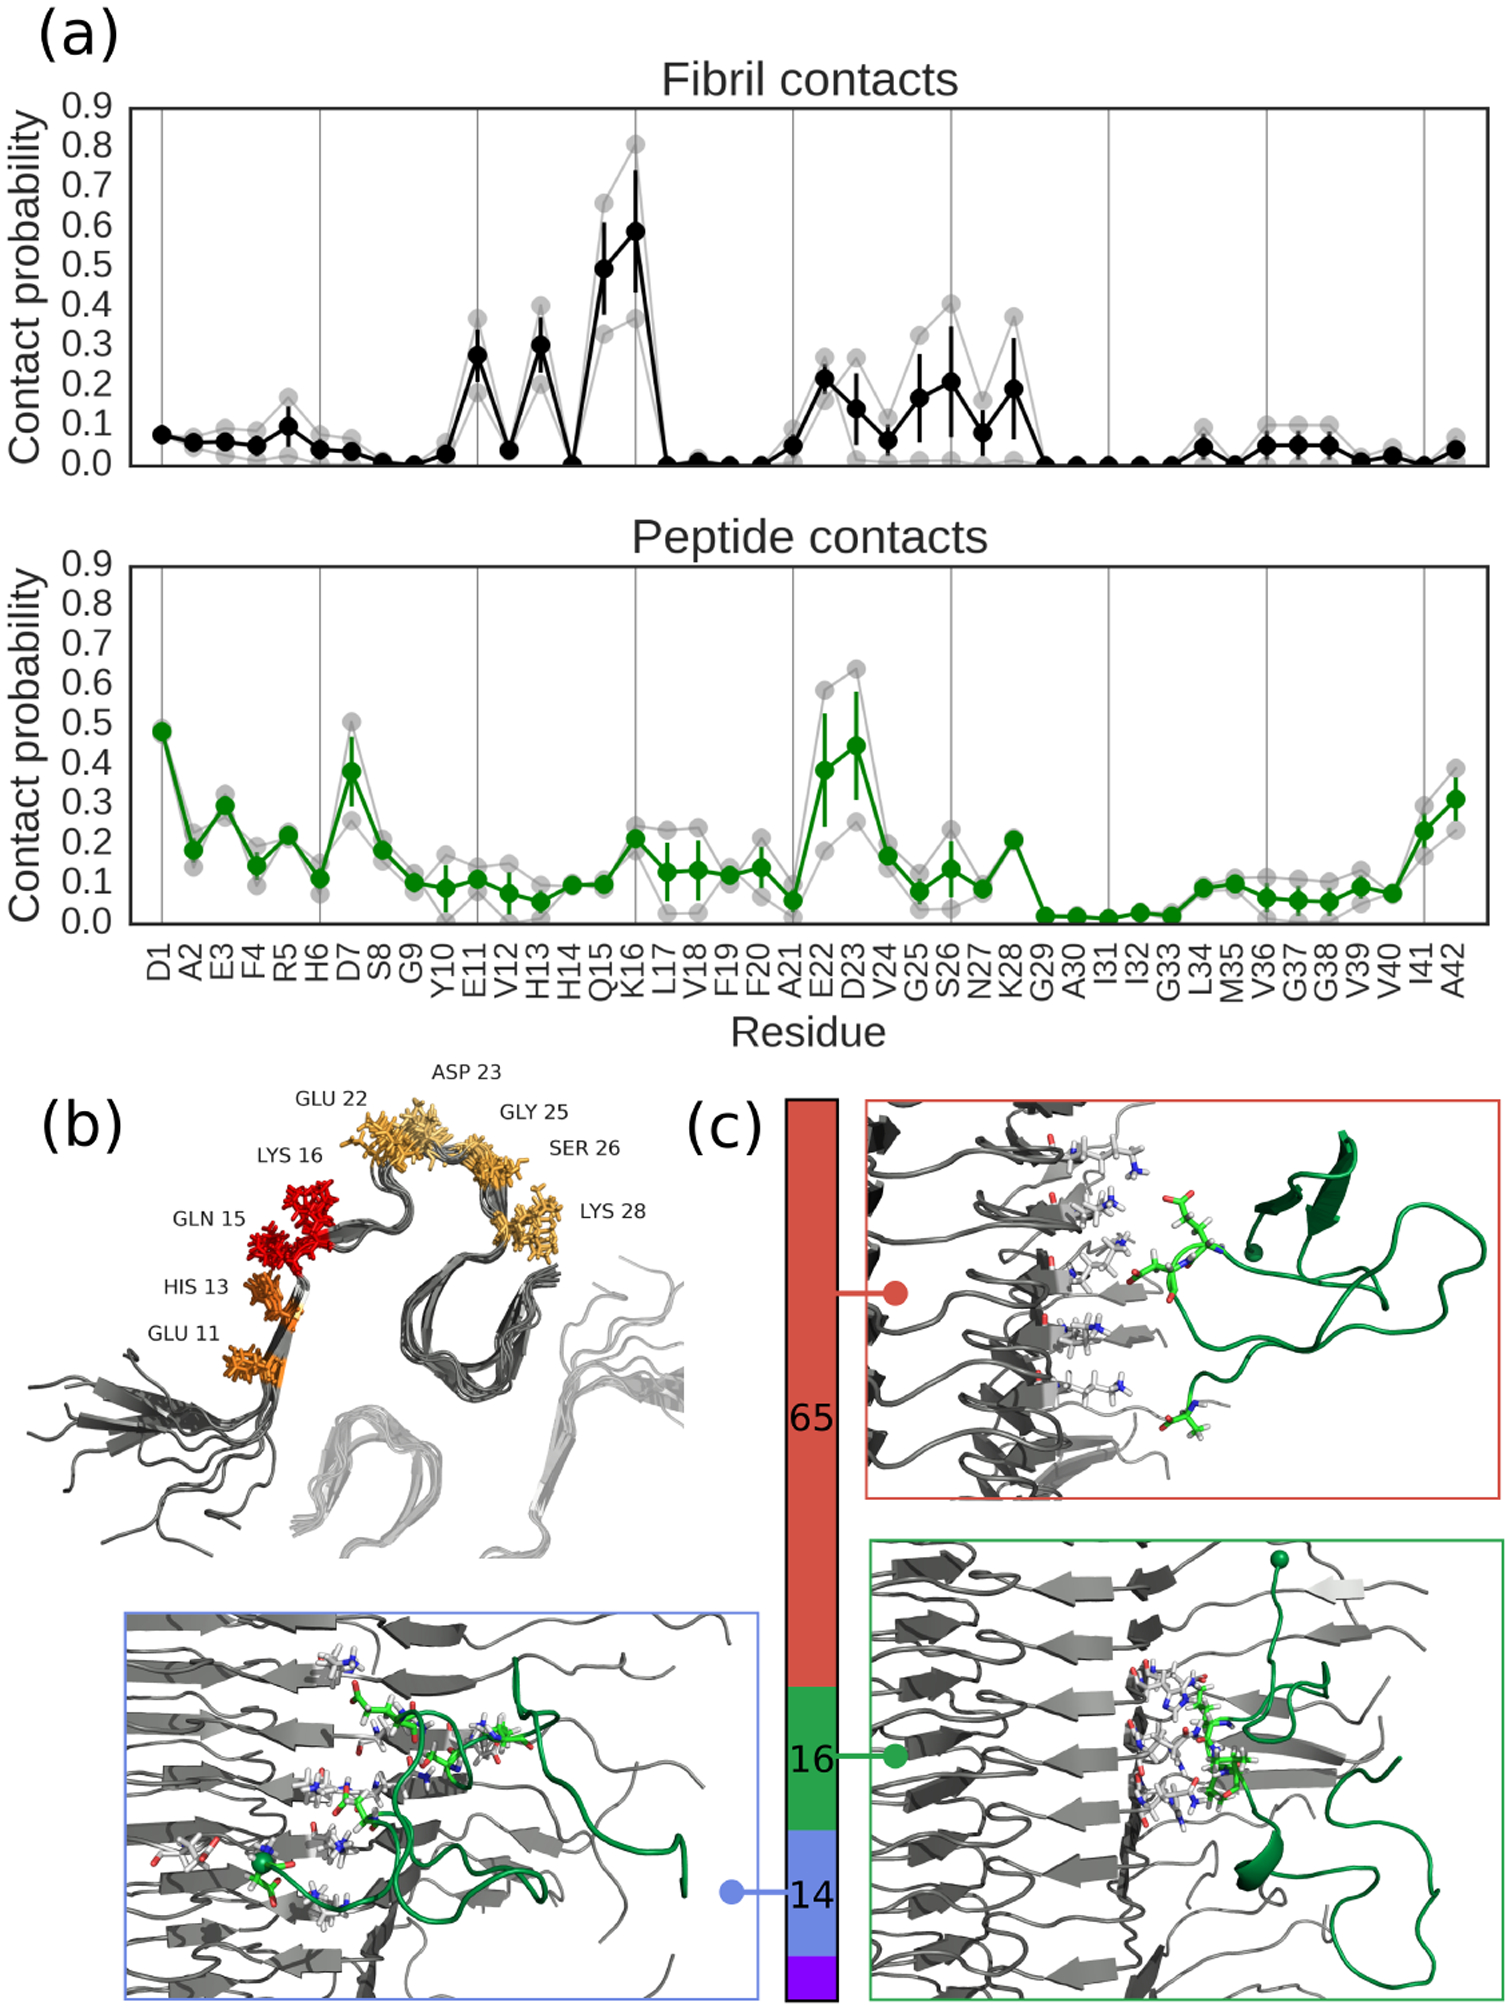
Figure 3:

Peptide-fibril contact analysis. (a) Probabilities of individual amino acids being involved in adsorption interactions in (top) the fibril surface and (bottom) the peptide. Translucent curves are results from the independent simulations, full colored curves are averages and error bars are standard errors. (b) Structural visualization of adsorption hotspots on the fibril, with the color of the amino acid getting more red as the residue is more likely to be involved. Translucent fibril shows approximate location of second protofibril in a C2 symmetric arrangement, as suggested is appropriate for Aβ42 fibrils by other structural studies.34–36 (c) Clustering analysis of binding modes showing top three interaction motifs, with colored bar denoting statistical weight of each cluster and inset structures showing structures closest to cluster centroids. N-termini shown as spheres, and all figures made using PyMOL.
