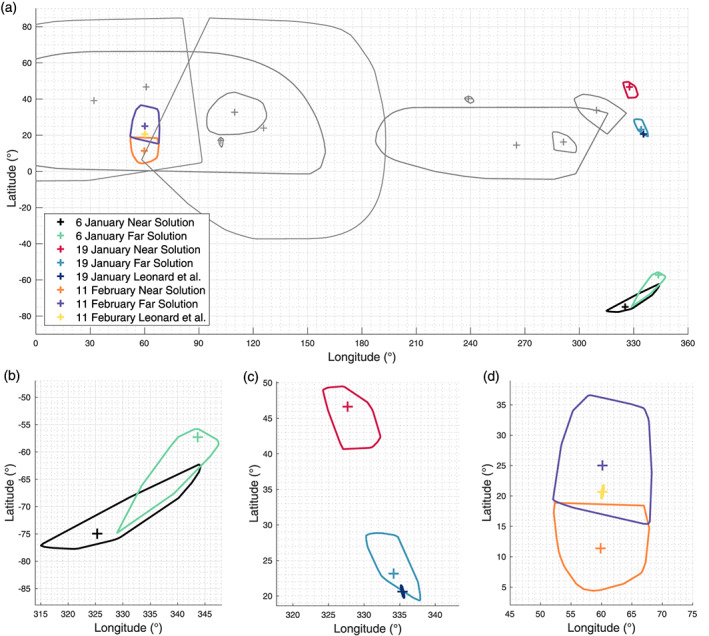
Figure 4.

(a) Ejection location solutions for all events shown with 3‐sigma uncertainties on a global grid. The three largest observed events (Table 1) are shown in color as specified in the legend. Eight smaller events (Table 2) are shown in gray. (b–d) Locations of the three events with the most observed particles: (b) 6 January, (c) 19 January, and (d) 11 February. Also shown are the independent solutions for the 19 January and 11 February events from Leonard et al. (2020).
