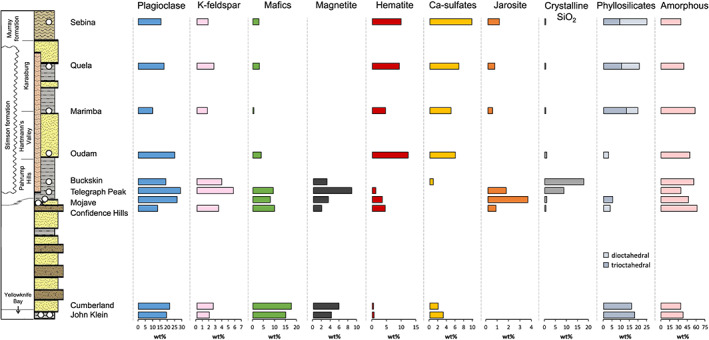
Figure 10.

Crystalline, phyllosilicate, and amorphous material distributions for drilled samples analyzed by CheMin in Gale crater. Phase distributions shown are the maximum crystalline abundances (minimum amorphous abundance; Table S3) calculated for each sample. Data for samples stratigraphically below Oudam can be found in Vaniman et al. (2014) (Cumberland and John Klein), Rampe et al. (2017) (Confidence Hills, Mojave, Telegraph Peak, and Buckskin), and Morris et al. (2016) (Buckskin).
