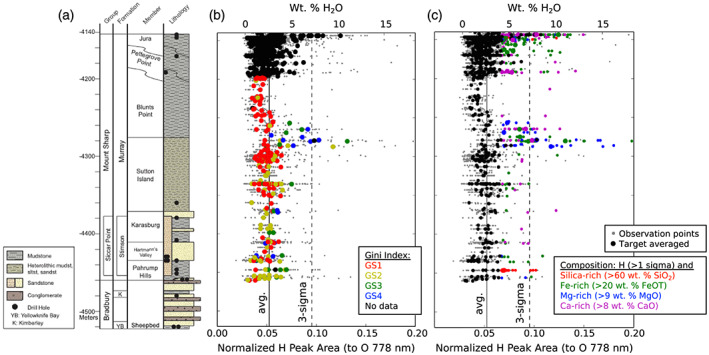
Figure 1.

(a) The Gale crater stratigraphic column (Fedo et al., 2018) with drill sites marked as solid black points and (b and c) the normalized H peak area versus elevation for all ChemCam measured Murray formation bedrock targets. The smaller points are individual point observations, and the larger points are target averaged. Colors in (b) indicate Gini index mean score approximated grain size classes, when available (from Rivera‐Hernández et al., 2020). Colors in (c) indicate compositions of high Si, Fe, Mg, or Ca.
