
Figure 2.
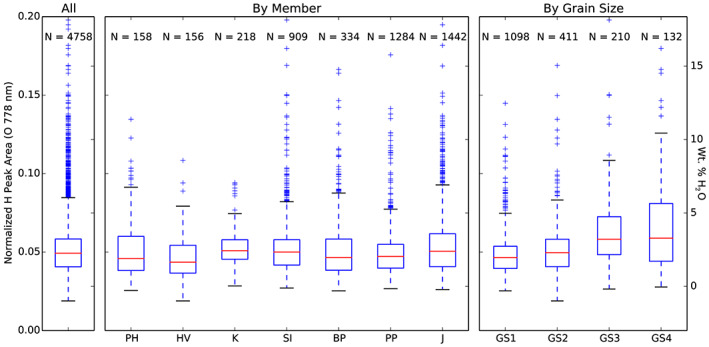
Boxplots showing the distribution of normalized H peak areas for (a) all Murray formation bedrock measurements, (b) each member of the Murray formation, and (c) each Gini index mean score categorized grain size class. The members are Pahrump Hills (PH), Hartmann's Valley (HV), Karasburg (K), Sutton Island (SI), Blunts Point (BP), Pettegrove Point (PP), and Jura (J). The grain size classes are coarse silt and smaller (GS1), coarse silt to very fine sand (GS2), very fine to medium sand (GS3), and medium to very coarse sand (GS4). The box extends from the lower to upper quartile values of the data, with a line at the median. The whiskers extend from the box to show the range of the data. Outlier points are defined as above or below 1.5 times the interquartile range from the median.