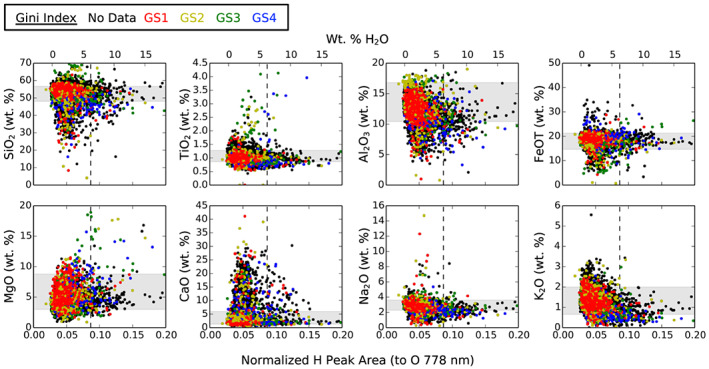
Figure 3.

Normalized H peak area, or wt.% H2O, versus ChemCam major oxides for all Murray formation bedrock observation points. Colors indicate grain size as estimated by the Gini index mean score when available. Vertical dashed line signifies 3‐sigma high H outliers. Shaded regions are typical Murray bedrock compositions (Frydenvang, 2020).
