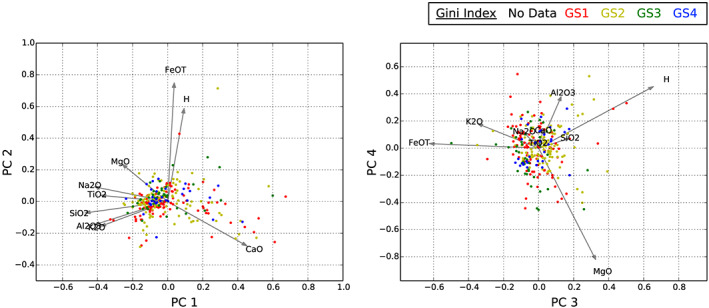
Figure 6.

Principal components analysis of Murray formation bedrock observation points containing high H (>1 sigma) chemical composition in the Rock Hall area (elevation greater than −4,150 m and less than −4,140 m). Colors indicate grain size as measured by the Gini index mean score. The arrows are the original major oxide and H data axes, projected into the eigenvector space. The arrow lengths represent amount of variance explained by each dimension.
