Figure 5.

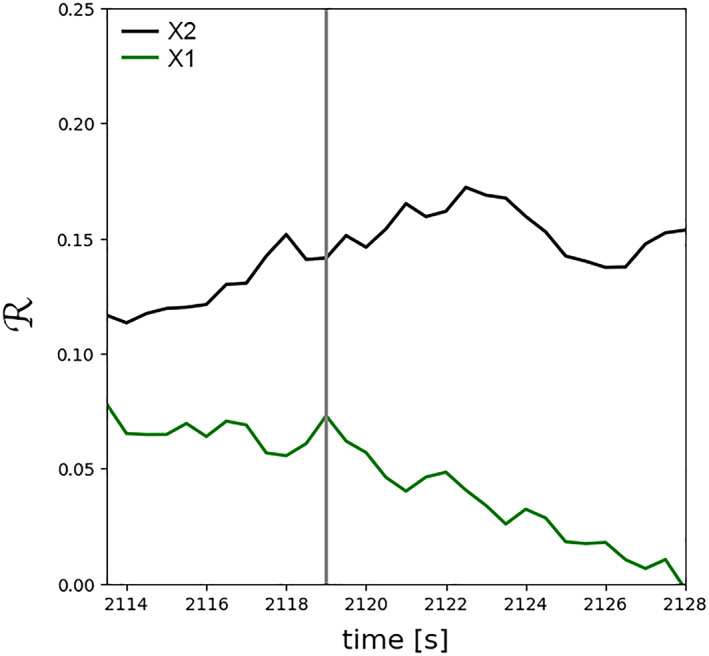
Temporal profile of the normalized reconnection rate, , at the X1 and X2, in the reference frame of the X‐points. The vertical gray line indicates the simulation timeframe t = 2,119.0 s.

Temporal profile of the normalized reconnection rate, , at the X1 and X2, in the reference frame of the X‐points. The vertical gray line indicates the simulation timeframe t = 2,119.0 s.