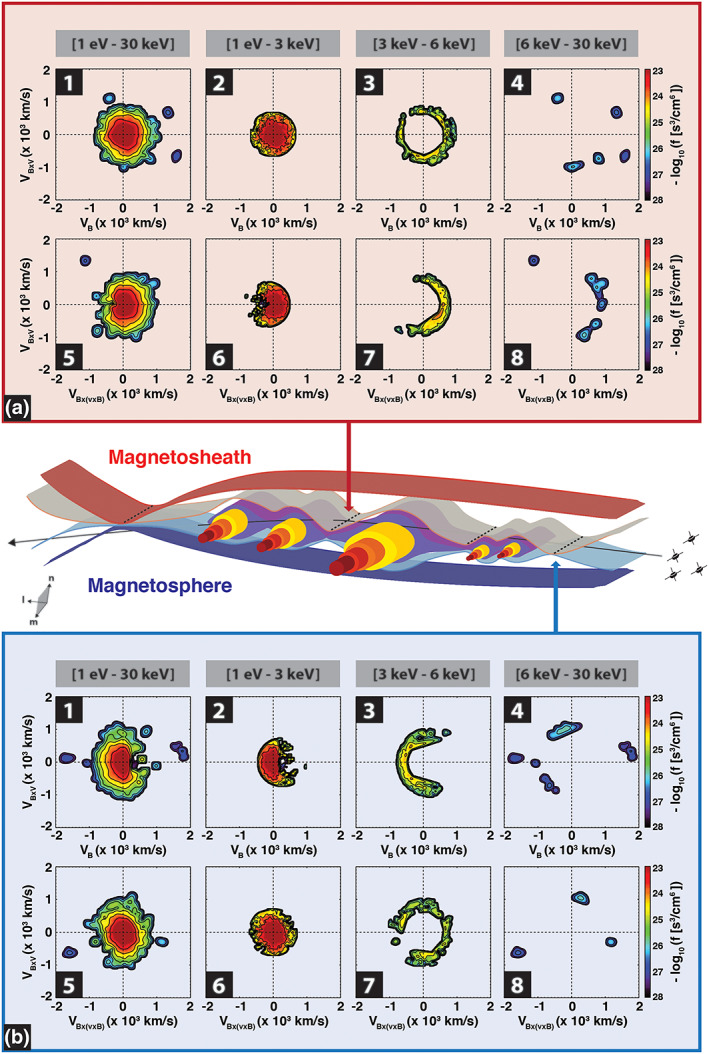
Figure 8.

Schematic of the approximate locations and orientations of the observed ion‐scale FTEs, shown as out‐of‐plane cylinders wherein the magnetic field intensity enhances (darker shade) near the FTE core regions, and the adjacent reconnection X‐lines, in the FTE's frame of reference and in the LMN coordinates. The X‐lines are marked by dashed lines. The magnetosheath and magnetospheric magnetic flux are distinguished and shown as red‐ and blue‐shaded surfaces, respectively. The MMS spacecraft trajectory, shown as a black arrow traversing across the structures, is estimated based on the MMS observations. The blue (B) and red (A) arrows/panels represent ion velocity distribution slices in the vicinity of the two observed X‐lines at 00:58:26 and 00:59:15 UT, respectively. The energy bins are divided into four energy bins organized in two rows: panels (1–4) the VB − VB × V slice and panels (5–8) the VB × V − VB × (B × V) slice, where V B represents the velocity along the magnetic field orientation. VB × V and VB × (B × V) are along (B × V) and B × (B × V) directions, where V is the ion bulk velocity. The energy bins include (panels 1 and 5) 1 eV–30 keV, (panels 2 and 6) 1 eV–3 keV, panels (3 and 7) 3–6 keV, and panels (4 and 8) 6–30 keV. The ion bulk velocity is subtracted from the velocity distribution functions.
