
Figure 8.
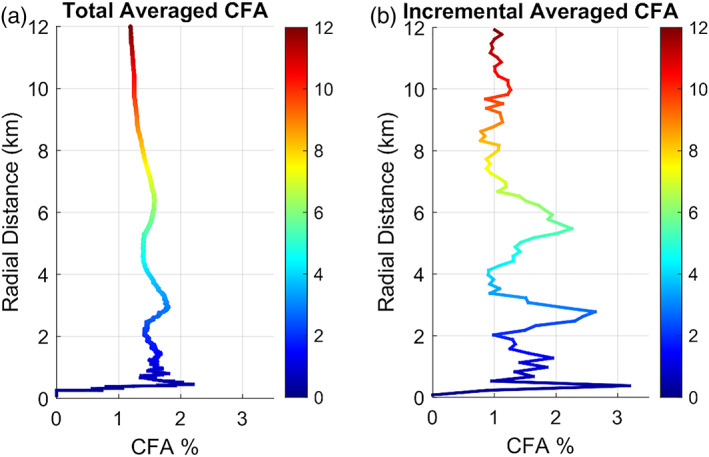
Graphs of the CFA shown in Figure 7 with radial distance from the lander. Graph (a) shows the cumulative average rock abundance with distance calculated by taking the average of all of the 150 m CFA measurements within the distance shown. Graph (b) shows the incremental average rock abundance in 150 m annuli calculated by taking the average of all 150 m CFA measurements at 150 m annuli at the distance shown. Rock measurements are from Golombek et al. (2017).