
Figure 9.
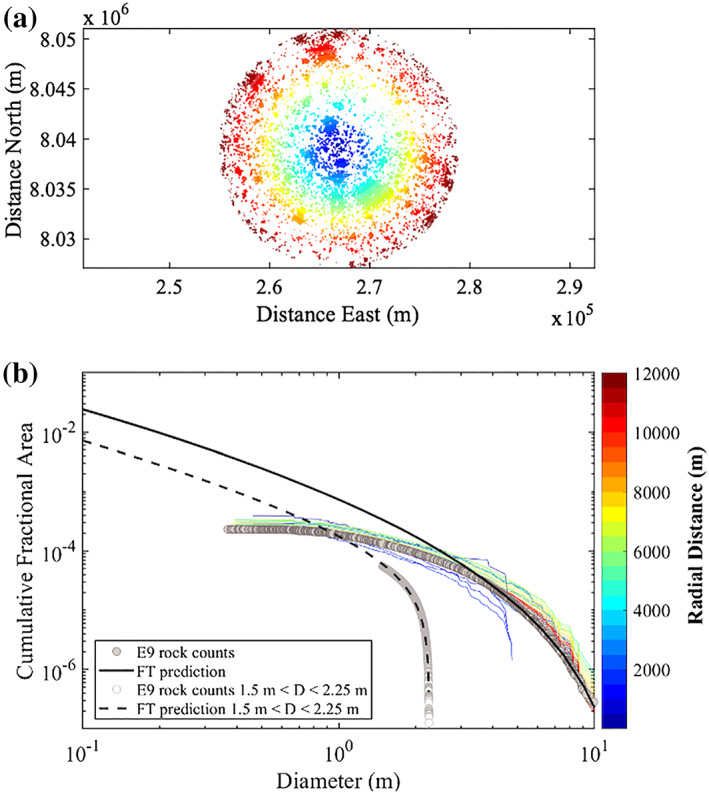
Plot of rocks color coded by radial distance in 500 m steps from the lander (a) and the corresponding size‐frequency distribution of CFA versus diameter (b). Rock shadow detections of all diameters (gray circles in b) as well as those between 1.5 and 2.25 m over 35 complete HiRISE images in the landing ellipse are from Golombek et al. (2017). The solid black and black dashed lines in (b) are the predictions from fragmentation theory for all diameters and those between 1.5 and 2.25 m prior to landing, respectively (Golombek et al., 2017). The blue lines indicate distributions within a 4 km radius, yellow around 7 km radius, and red beyond 9 km radius from the lander (in b). The fragmentation predictions for the CFA and slope of the size‐frequency distribution matches measurements from the lander for diameters <0.05 m shown in Figure 10.