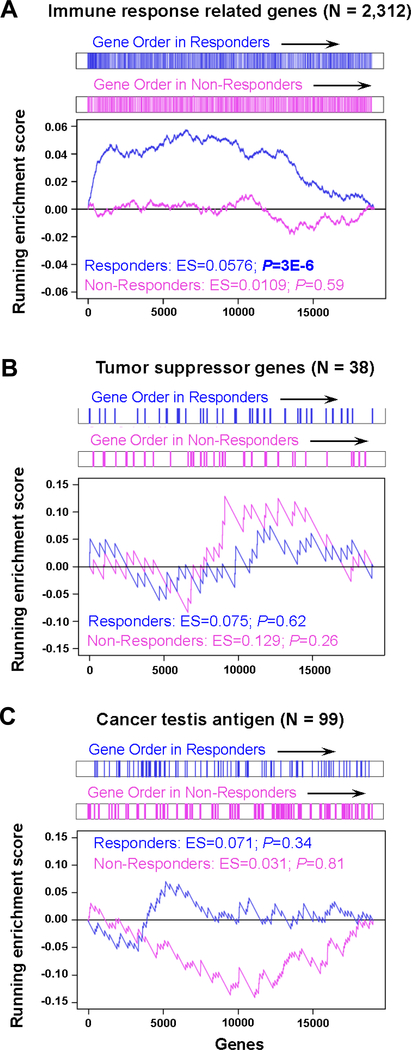
Figure 1. Genes related to immune response are significantly upregulated in responders, but not in non-responders, following AZA treatment.
Gene set enrichment analysis (GSEA) plots show the enrichment in responders (n = 17) and non-responders (n = 9) A, Immune response–related genes; B, Tumor suppressor genes; C, Cancer testis antigens.

