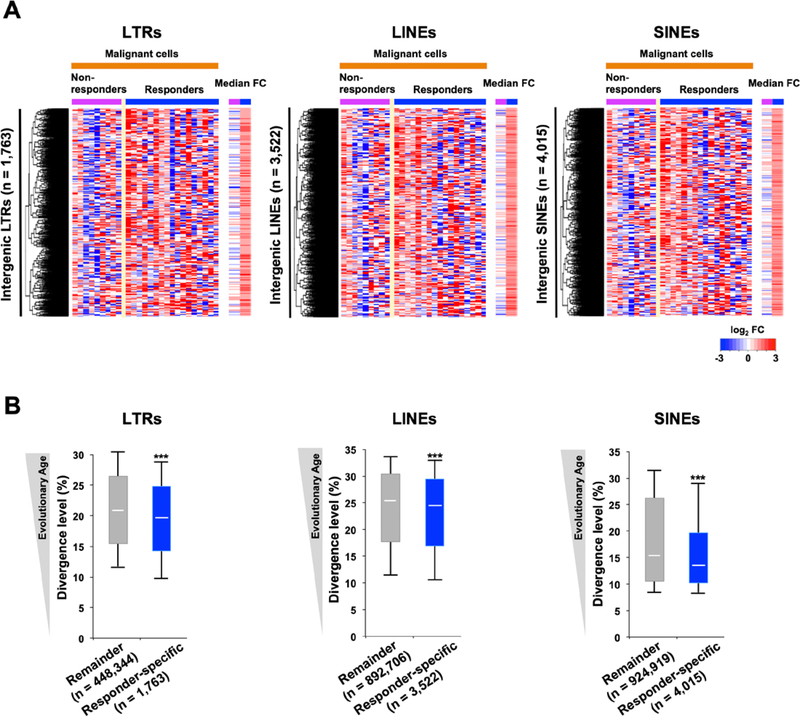
Figure 3. Specific evolutionarily young transposable elements show responder-specific induction by AZA treatment.
A, Intergenic transposable elements (TEs) that were upregulated in responders (median FC ≥ 2) but not in non-responders (median FC < 2). The median FC is calculated by using posttreatment comparing to pretreatment median RPKM values in the non-responders or responders (highest value from the multiple time points is used). B, The distribution of divergence levels in individual TEs shown in A. “Remainder” refers to LTRs that were not responder-specific upregulated by treatment. Each box represents the data between the 25th and 75th quartiles. The whiskers are drawn down to the 10th percentile and up to the 90th percentile. The difference between the two groups is significant for all three TE groups. P-values were calculated using two-tailed Mann-Whitney U test: (∗∗∗); P < 0.001.

