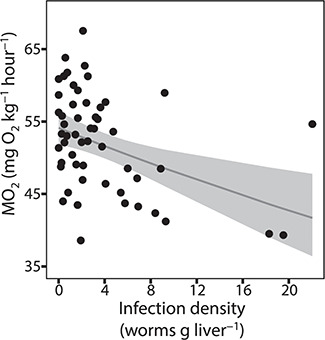
Figure 3.

The standard metabolic rate (MO2, in mg O2 kg−1 h−1) of G. morhua (n = 58) with varying degrees of infection densities with C. osculatum. The thin grey line describes the association between infection density and standard metabolic rate, revealing a significant negative correlation. The grey boxes are 95% confidence intervals
