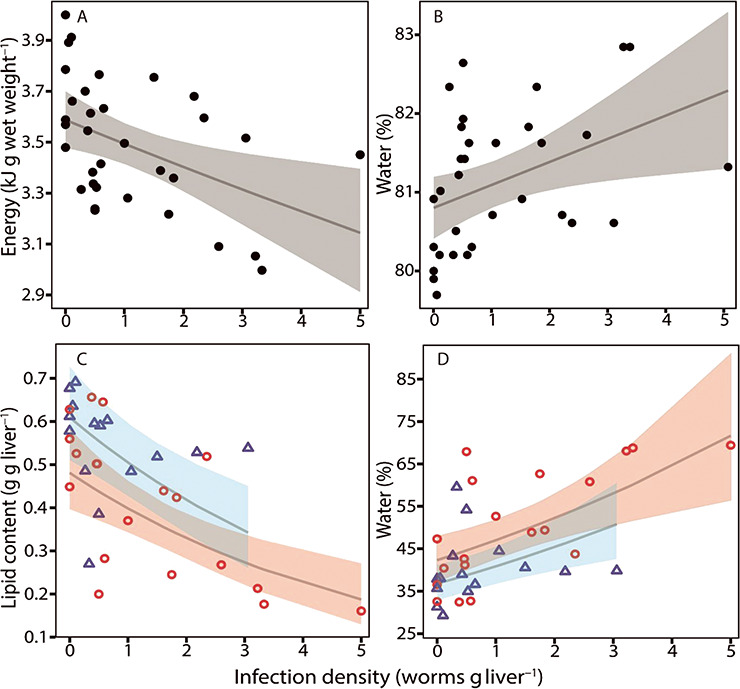
Figure 5.

(A) Total energy content (kJ g wet-weight−1) of the whole fish excluding the liver, (B) water content (%) of the whole fish, (C) lipid content of the liver (g g liver−1) and (D) water content of the liver (%), all in relation to changes in infection density as described by the thin grey lines. Both the total energy of the fish and lipid content of the liver decreased significantly with increasing infection density while water content increased significantly in both the fish and the liver with increasing infection density. In C and D, colours and symbols represent: blue and Δ = female, red and o = male. Grey, blue and red areas represent 95% confidence intervals.
