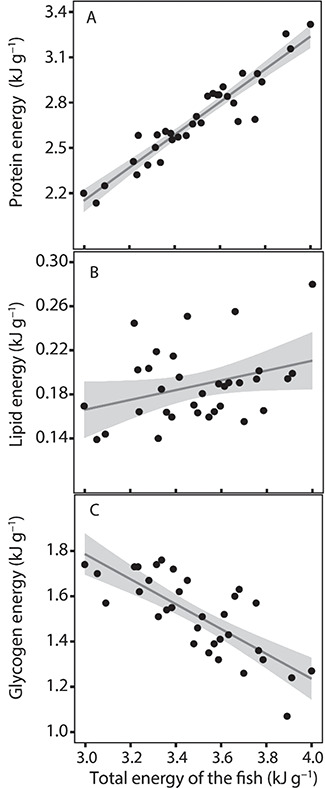
Figure 6.

Proportions of the fish energy source coming from (A) protein energy (kJ g−1), (B) lipid energy (kJ g−1) and (C) glycogen energy (kJ g−1), all in relation to the total energy of the fish (n = 33). As described by the thin grey lines, the proportion of energy in the fish coming from protein increased significantly with increasing energy of the fish, and likewise for lipid energy (though not significantly), whereas the amount of energy coming from glycogen sources decreased with the energy of the fish. The grey areas represent a 95% confidence interval
