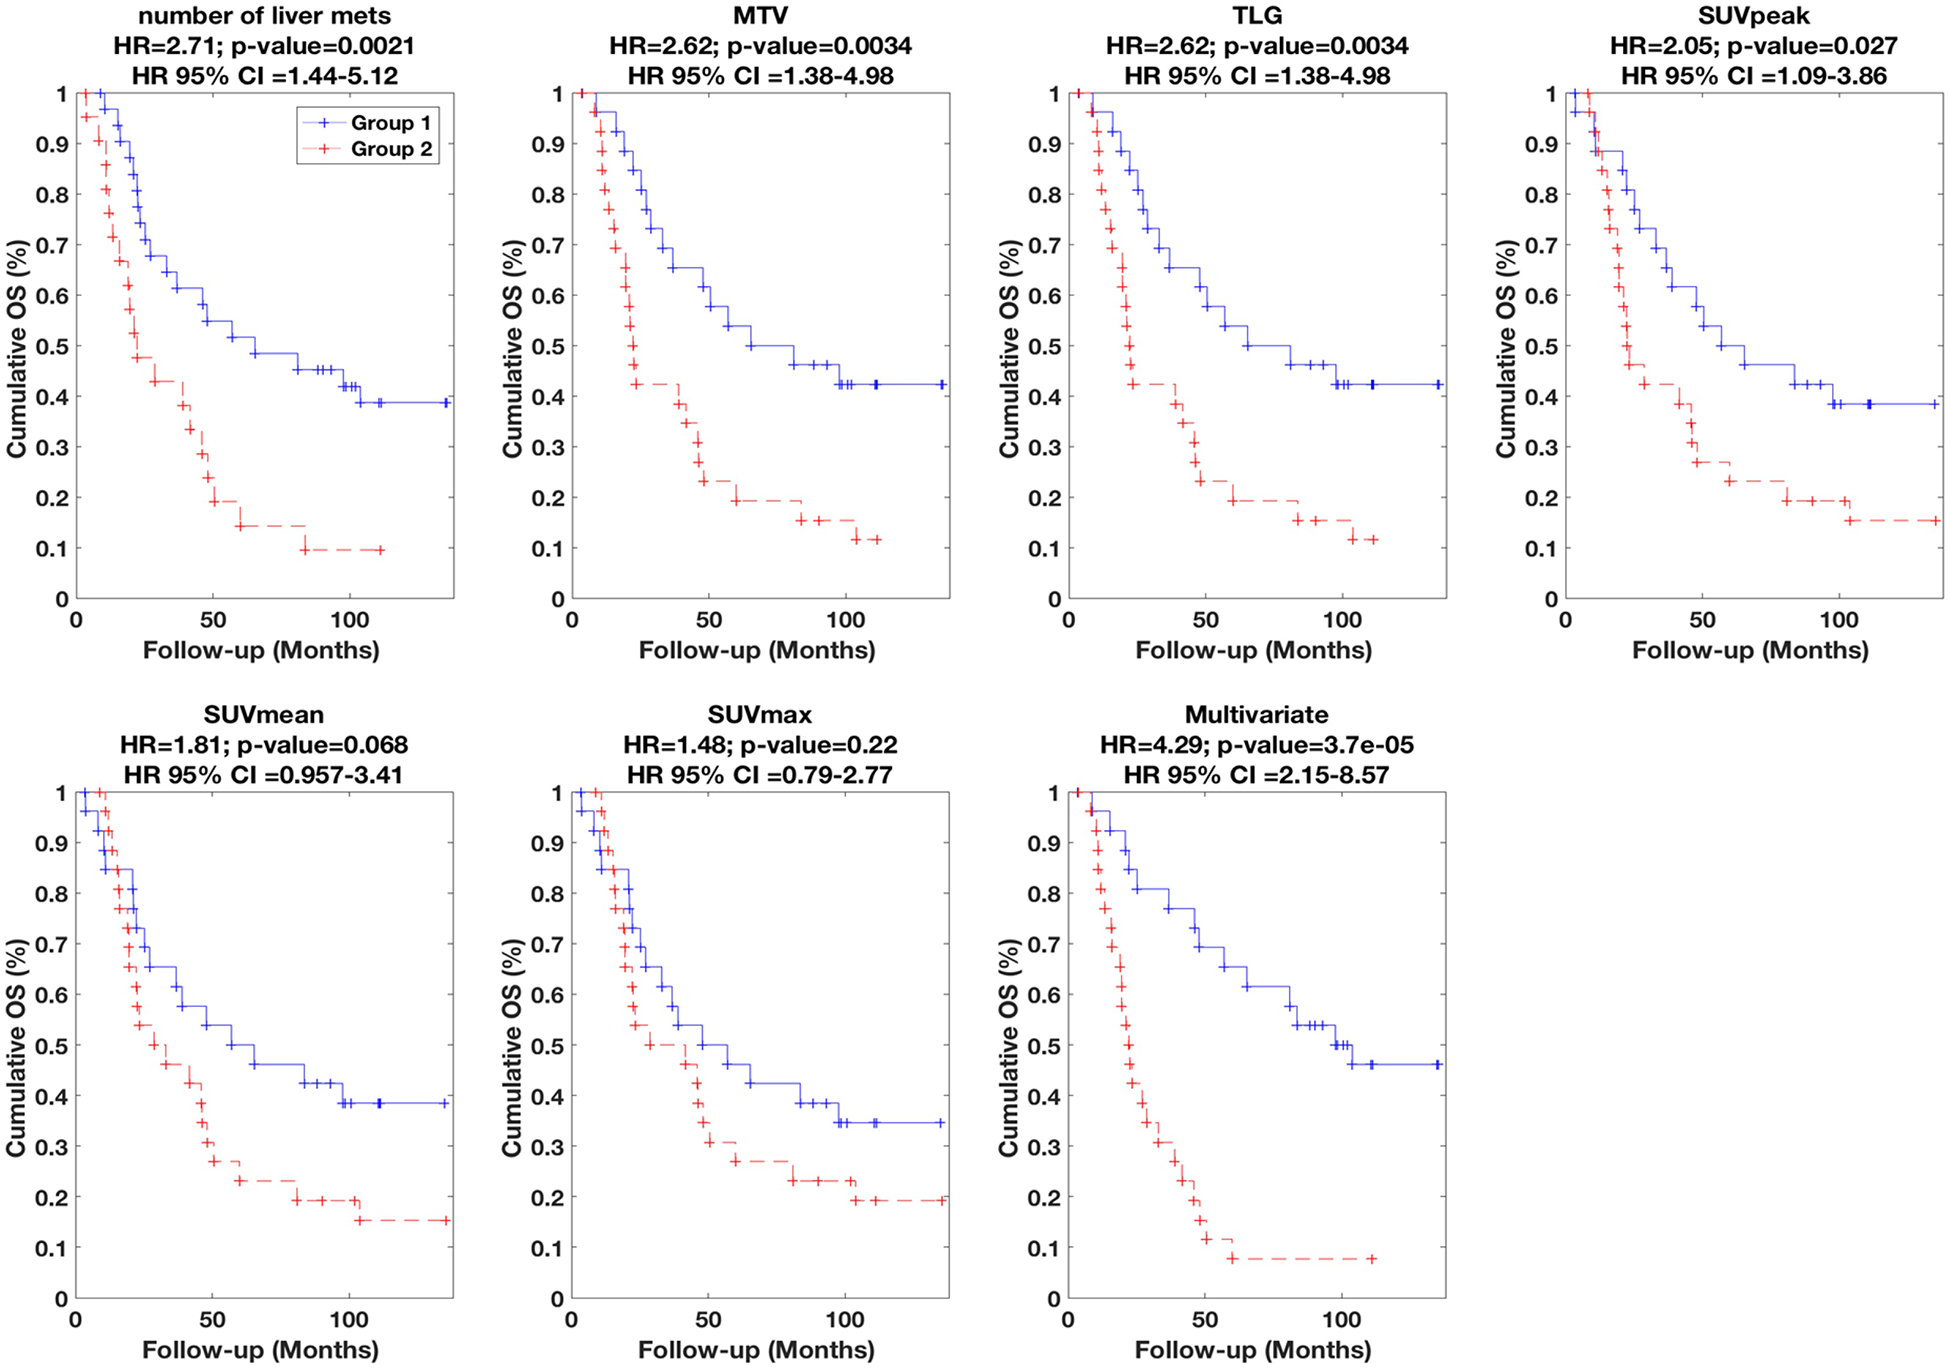
Figure 2.

Kaplan-Meier curves for OS. Univariate results are shown for six different metrics (number of liver mets, MTV, TLG, SUVpeak, SUVmean, SUVmax), while multivariate result is also shown (Table 2 lists parameters in model). (+) signs indicate events at steps or last follow-up otherwise. Segmentation was performed using 40% background-corrected SUVmax thresholding. HR as well as associated 95%-CI and p-values are also reported. Group 1 (lower risk) vs. Group 2 (higher risk) had 26 vs. 26 subjects in all plots, except for univariate number of liver mets (31 vs. 21).
