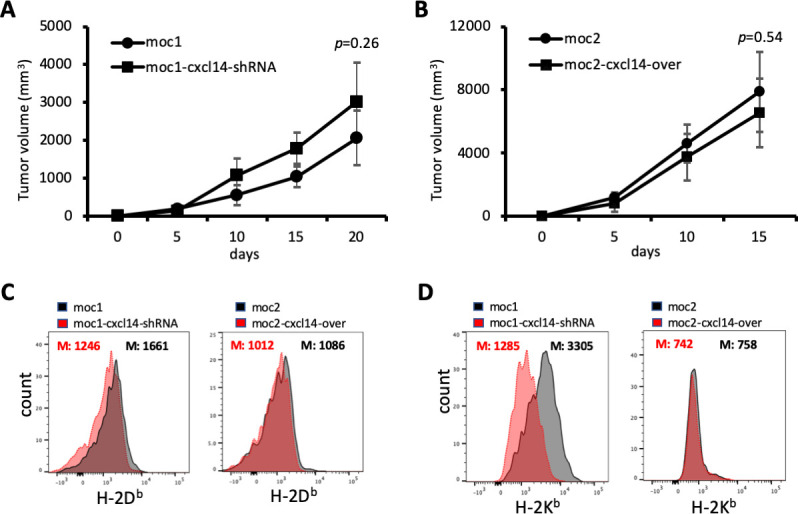
Figure 5.

CXCL14-related changes in tumor growth are T cell dependent. (A) Line plot shows growth of mouse oral cavity (MOC)1-derived tumors with and without CXCL14 knockdown after depletion of T cells. (B) Line plot shows growth of MOC2-derived tumors with and without CXCL14 overexpression after depletion of T cells. The effect of CXCL14 modulation is significantly diminished and no longer reaches statistical significance. (C) Plots show fluorescence corresponding to cell surface expression of H-2Db. CXCL14 knockdown in MOC1 cells resulted in a significant decrease in H-2Db (left panel), while CXCL14 overexpression in MOC2 cells did not result in a significant change (right panel). (D) Plots show fluorescence corresponding to cell surface expression of H-2Kb. CXCL14 knockdown in MOC1 cells resulted in a significant decrease in H-2Kb (left panel), while CXCL14 overexpression in MOC2 cells did not result in a significant change (right panel).
