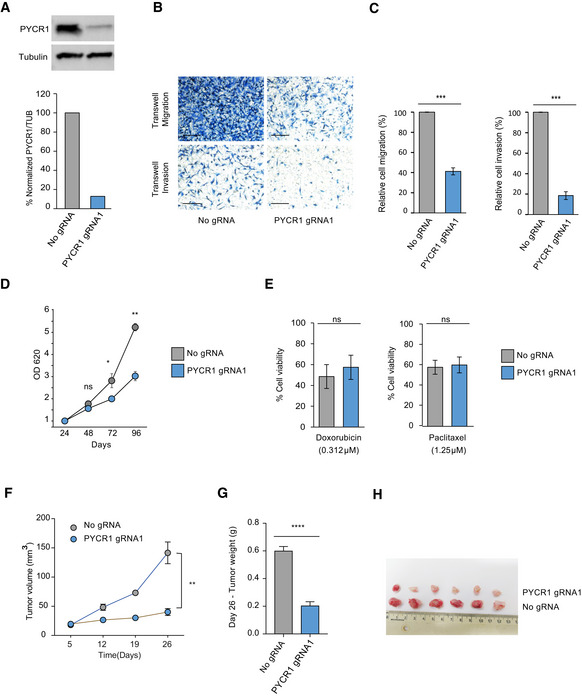
Western blots showing PYCR1 knockout in MDA‐MB-231 cells. Bar plot shows quantitative analysis of the Western blot.
Representative pictures of Transwell migration and invasion after PYCR1 knockout. Scale bar: 100 μm.
Bar plots represent mean ± SD of three biological replicates of the invasion and migration assays. Samples are compared using paired Student's t‐test. P values are indicated as ***P < 0.001.
Growth measurements of MDA‐MB-231 wild‐type and PYCR1 KO cells over 96 h. Data represent mean ± SE of three biological replicates. Samples are compared using paired Student's t‐test. P values are indicated as follows *P < 0.05 and **P < 0.01.
Bar plots show percentage of viable cells after treatment with 0.312 μM doxorubicin and 1.25 μM paclitaxel. Data represent mean ± SE of three biological experiments. Samples are compared using Student's t‐test.
Tumor volume measurements for 26 days in MDA‐MB-231‐injected NSG mice. CRISPR control (n = 6) and PYCR1 KO tumors (n = 6) without treatment are shown. Data represent mean ± SE. Samples on day 26 are compared using paired Student's t‐test, and P values are reported as follows **P < 0.01.
Bar plot indicates mean ± SE of tumor weight measurements for day 26. CRISPR control (n = 6) and PYCR1 KO tumors (n = 6) without treatment are shown. Samples are compared using paired Student's t‐test. P values are reported as **** P < 0.0001.
Picture of excised tumors on day 26.

