-
A
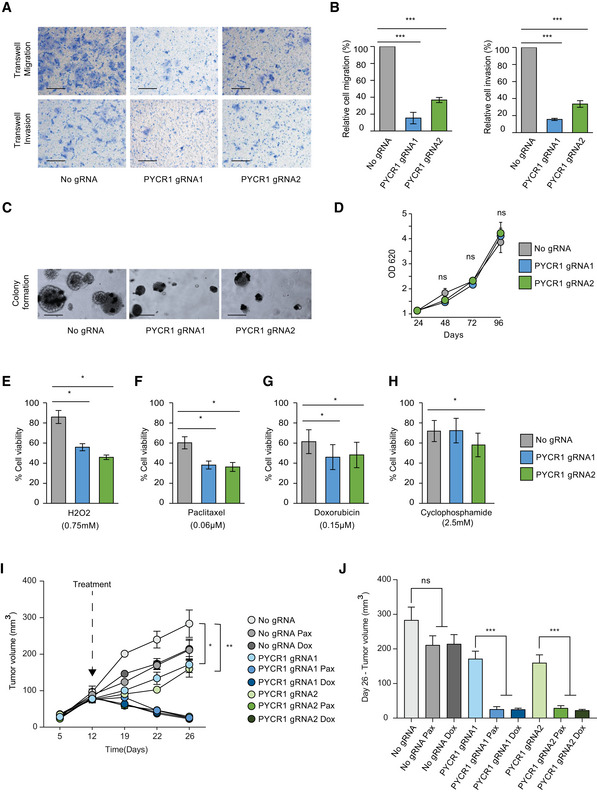
Representative pictures of Transwell migration and invasion after PYCR1 knockout. Scale bar :100 μm.
-
B
Bar plot represents mean ± SD of three biological replicates for Transwell migration and invasion. Samples were compared using Kruskal–Wallis test followed by Dunnett's test for multiple pairwise comparisons. Corrected P values are reported as follows ***P < 0.001.
-
C
Representative images of colony formation in soft agar upon PYCR1 KO. Scale bar: 100 μm.
-
D
Growth measurements of MCF7 wild‐type and PYCR1 KO cells over 96 h. Data represent mean ± SE of three biological experiments. Samples were compared using paired Student's t‐test.
-
E–H
Bar plots show percentage of viable cells after treatment with 0.75 mM H2O2 (E), 0.06 μM paclitaxel (F), 0.15 μM doxorubicin (G), and 2.5 mM cyclophosphamide (H). Data represent mean ± SE of three biological experiments. Samples are compared using Kruskal–Wallis test followed by Dunnett's test for multiple pairwise comparisons. Corrected P values are indicated as follows *P < 0.05.
-
I
Tumor volume measurements for 26 days in MCF7‐injected NSG mice. CRISPR control and PYCR1 KO tumors with (n = 8) and without treatment (n = 5) are shown. Data represent mean ± SE. Pax: paclitaxel, Dox: doxorubicin. Groups were compared by one‐way ANOVA followed by Tukey's multiple comparisons test for pairwise group comparisons. Corrected P values are reported as follows *P < 0.05, **P < 0.01. Shapiro–Wilk test was used to check data normality, and Bartlett test was used to examine homogeneity of variances.
-
J
Bar plot indicates mean ± SE of tumor volume measurements for day 26. CRISPR control and PYCR1 KO tumors with (n = 8) and without treatment (n = 5) were compared by one‐way ANOVA followed by Tukey's multiple comparisons test for pairwise group comparisons. Corrected P values are reported as follows ***P < 0.001. Shapiro–Wilk test was used to check data normality, and Bartlett test was used to examine homogeneity of variances.

