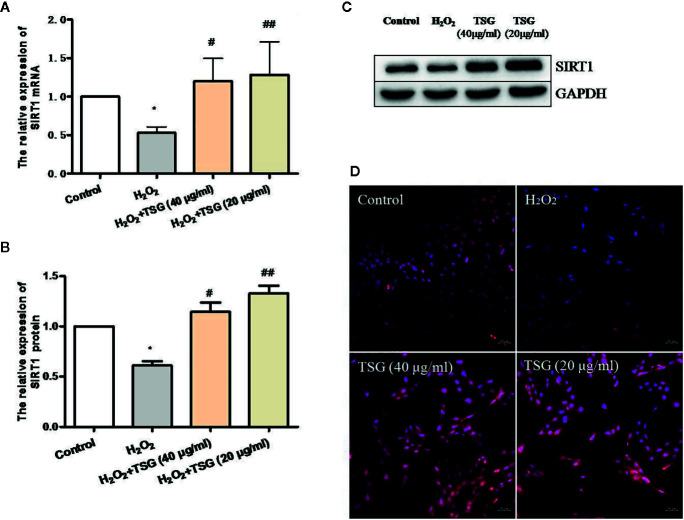
Figure 4.
TSG promoted SIRT1 expression in H2O2-induced HUVEC. (A) Real-time fluorescence quantitative PCR was used to detect the expression of SIRT1 mRNA. (B, C) Representative images of WB analysis and the semi-quantification of SIRT1. (D) Representative images of staining with DAPI (blue) and SIRT1-specific fluorometric probe (red) acquired using a laser scanning microscope. Values are expressed as mean ± SD (n = 3); *p <0.05 vs. control, #p < 0.05 and ##p < 0.01 vs. H2O2.

