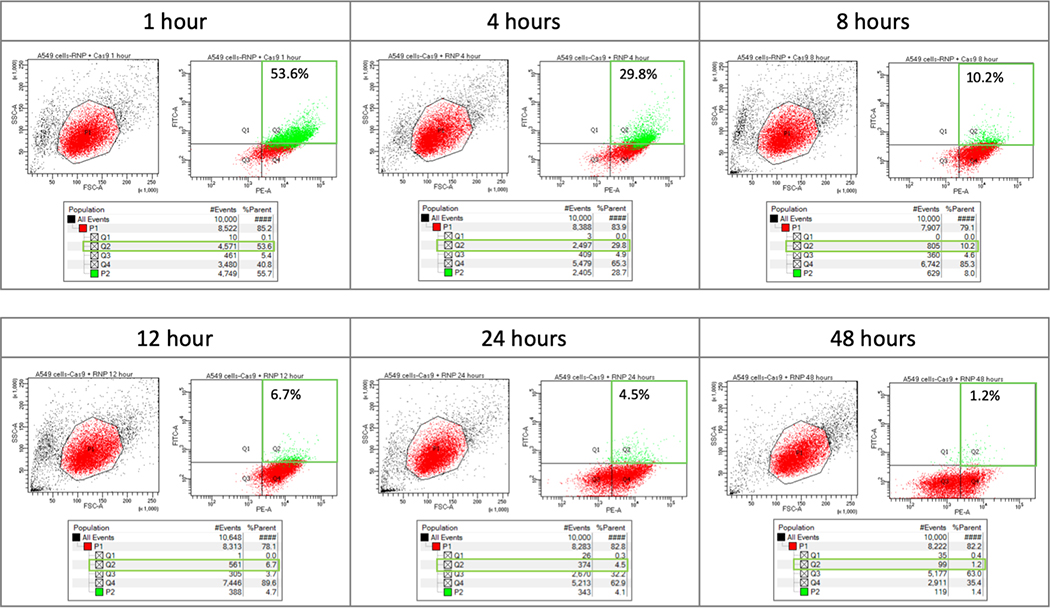
Figure 2.
Time course analysis of fluorescently labeled RNP using FACS. A549 cells were transfected with 20 pmol of fluorescently labeled RNP complex and analyzed via FACS to determine fluorescence intensity at 1, 4, 8, 12, 24, and 48 hours post nucleofection. The red area (P1) of the left hand graph contains the population of A549 cells that were further analyzed for fluorescence intensity. Quadrant 1 (Q1) would contain cells with GFP fluorescence. Quandrant 2 (Q2) would contain cells with both GFP and ATTO 550 fluorescence. Quadrant 3 (Q3) would contain cells that do not exceed background fluorescence. Quadrant 4 (Q4) would contain cells with ATTO 550 fluorescence. A549 cells with both fluorescently labeled RNP components – Cas (GFP) and tracrRNA (ATTO550), fall within quadrant 2 (outlined in green). Population 2 (P2), highlighted in green, was gated to capture GFP-positive cells that may have been omitted with standard gating. The table under each plot contains raw data for each quadrant.

