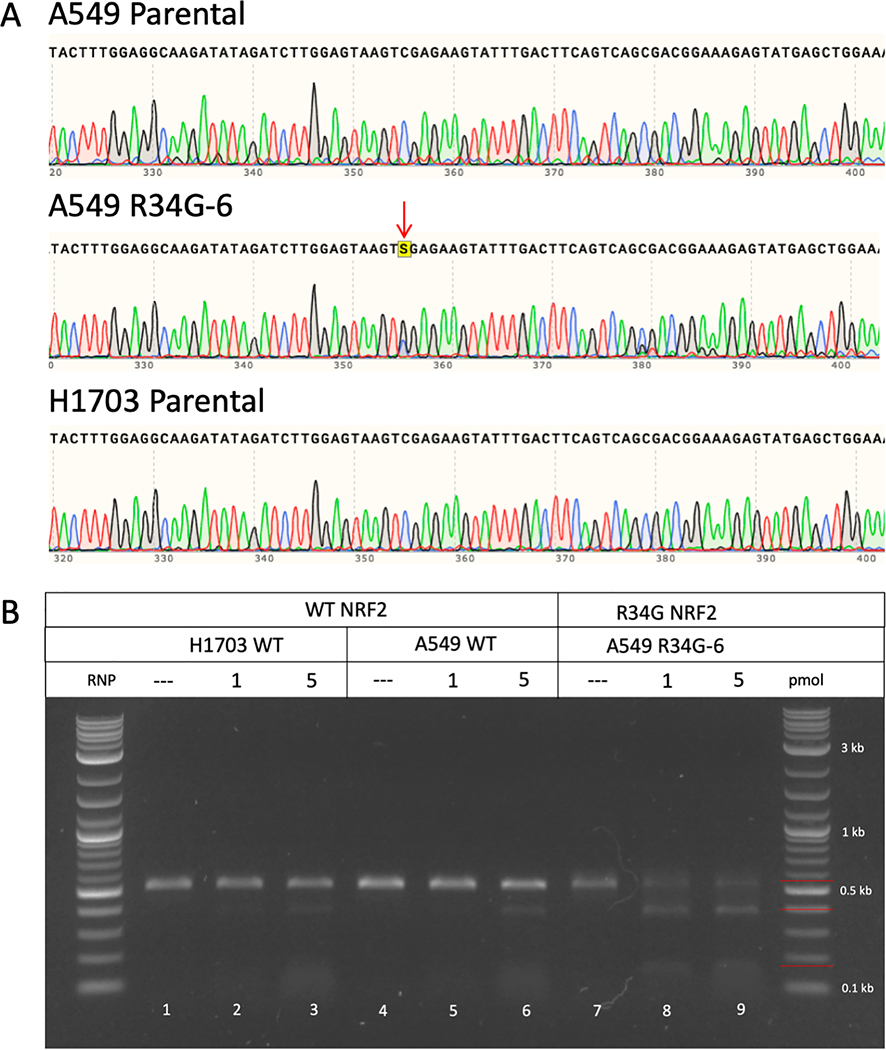
Figure 6.
(A) NRF2 sequence analysis of A549 and H1703 parental cell lines and the A549 R34G-mutated cell line. Genomic DNA from each cell line was isolated and amplified across exon 2 of the NRF2 gene. Amplicons were sanger sequenced and analyzed for mutations. A549 and H1703 parental cell lines contain a wildtype sequence; whereas the A549 R34G-6 clone contains a heterozygous R34G mutation, indicated by the red arrow. (B) In vitro cleavage reaction using wildtype and R34G-mutated NRF2 amplicons with varying concentrations of R34G RNP. Genomic DNA was isolated from H1703 and A549 parental cell lines and the A549 R34G-mutated cell line and amplified. Purified NRF2 amplicons were incubated with 1 and 5 pmol of R34G RNP and the reactions were visualized by gel electrophoresis. Lanes 1, 4, and 7 are NRF2 amplicons incubated with buffer only (negative control). Lanes 2, 3 and 5, 6 are wildtype NRF2 amplicons incubated with R34G RNP. Lanes 8 and 9 are R34G mutated NRF2 amplicons incubated with R34G RNP. The red bars (right handside of ladder) indicate the size of the uncut amplicons (530 bp) and cleavage products (145 & 385 bp).

