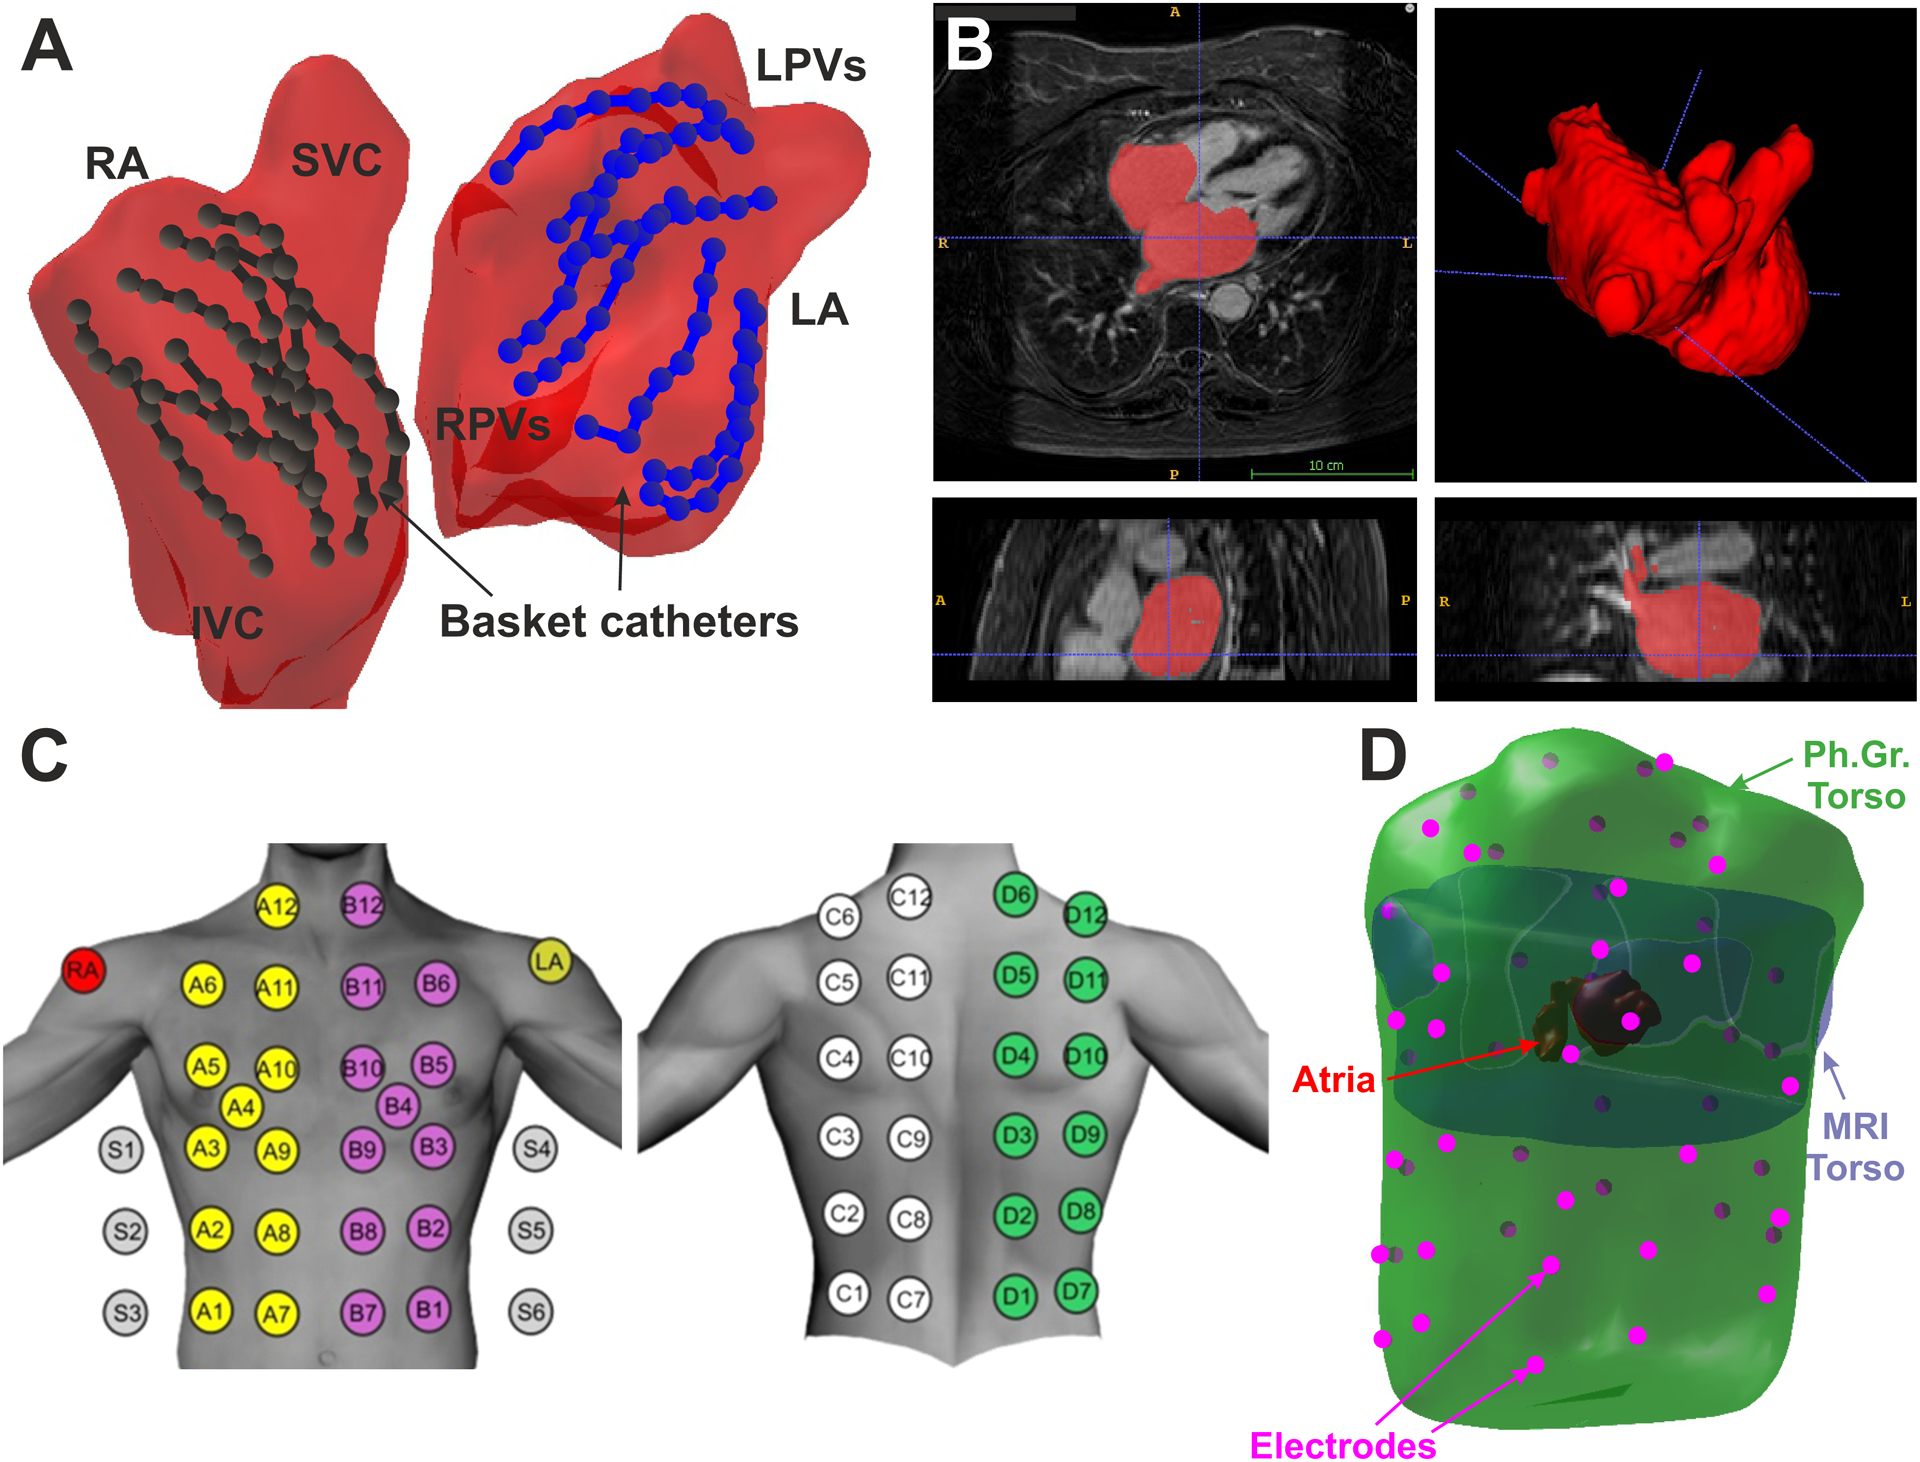
Figure 1.

Schematic view of the experiment set-up. A. Atrial anatomy (red) with 2 basket catheters in left (blue) and right (black) atria. B. Atrial anatomy segmentation from CT scan. C. Surface ECG electrode distribution. D. 3D meshes of the CT torso (purple), photogrammetry torso (green), atrial anatomy (red) and surface electrodes (pink).
