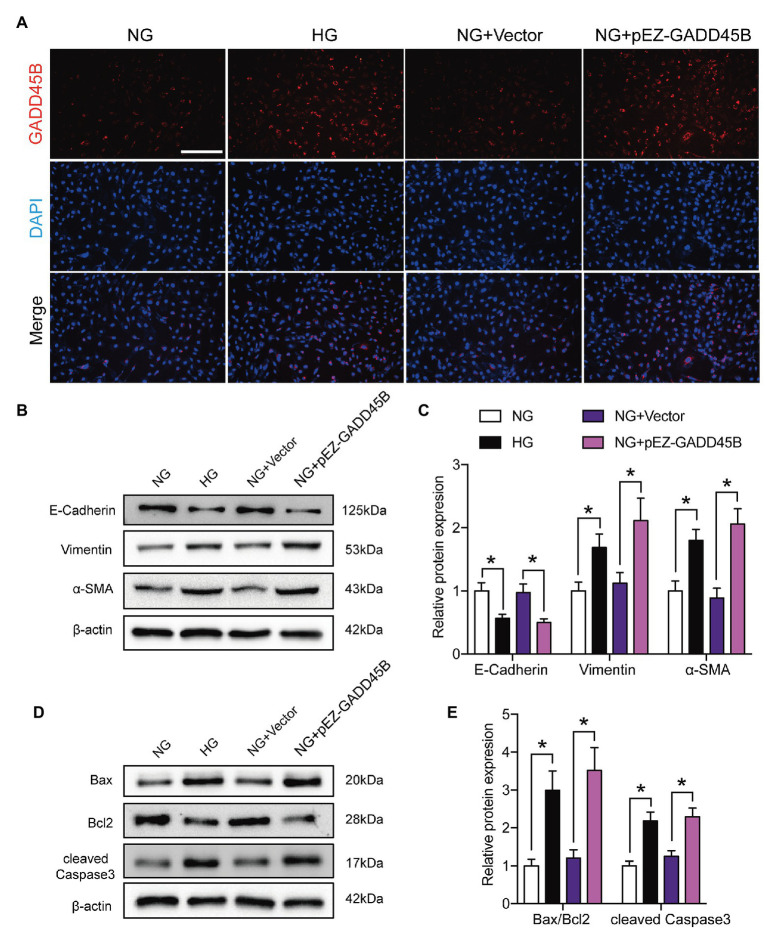
Figure 4.
Effects of GADD45B overexpression on renal tubular EMT and apoptosis in HK-2 cells. (A) Representative images of immunofluorescence staining of GADD45B in HK-2 cells. Original magnification = 200. Scale bar = 200 μm. (B) Western blot bands showing E-cadherin, Vimentin, and α-SMA protein expression in HK-2 cells. (C) Quantitative analysis of (B), N = 4. (D) Western blot bands showing Bax, Bcl2, and cleaved Caspase 3 protein expression in HK-2 cells. (E) Quantitative analysis of (D), N = 4. The data are presented as the mean ± SD. * p < 0.05.

