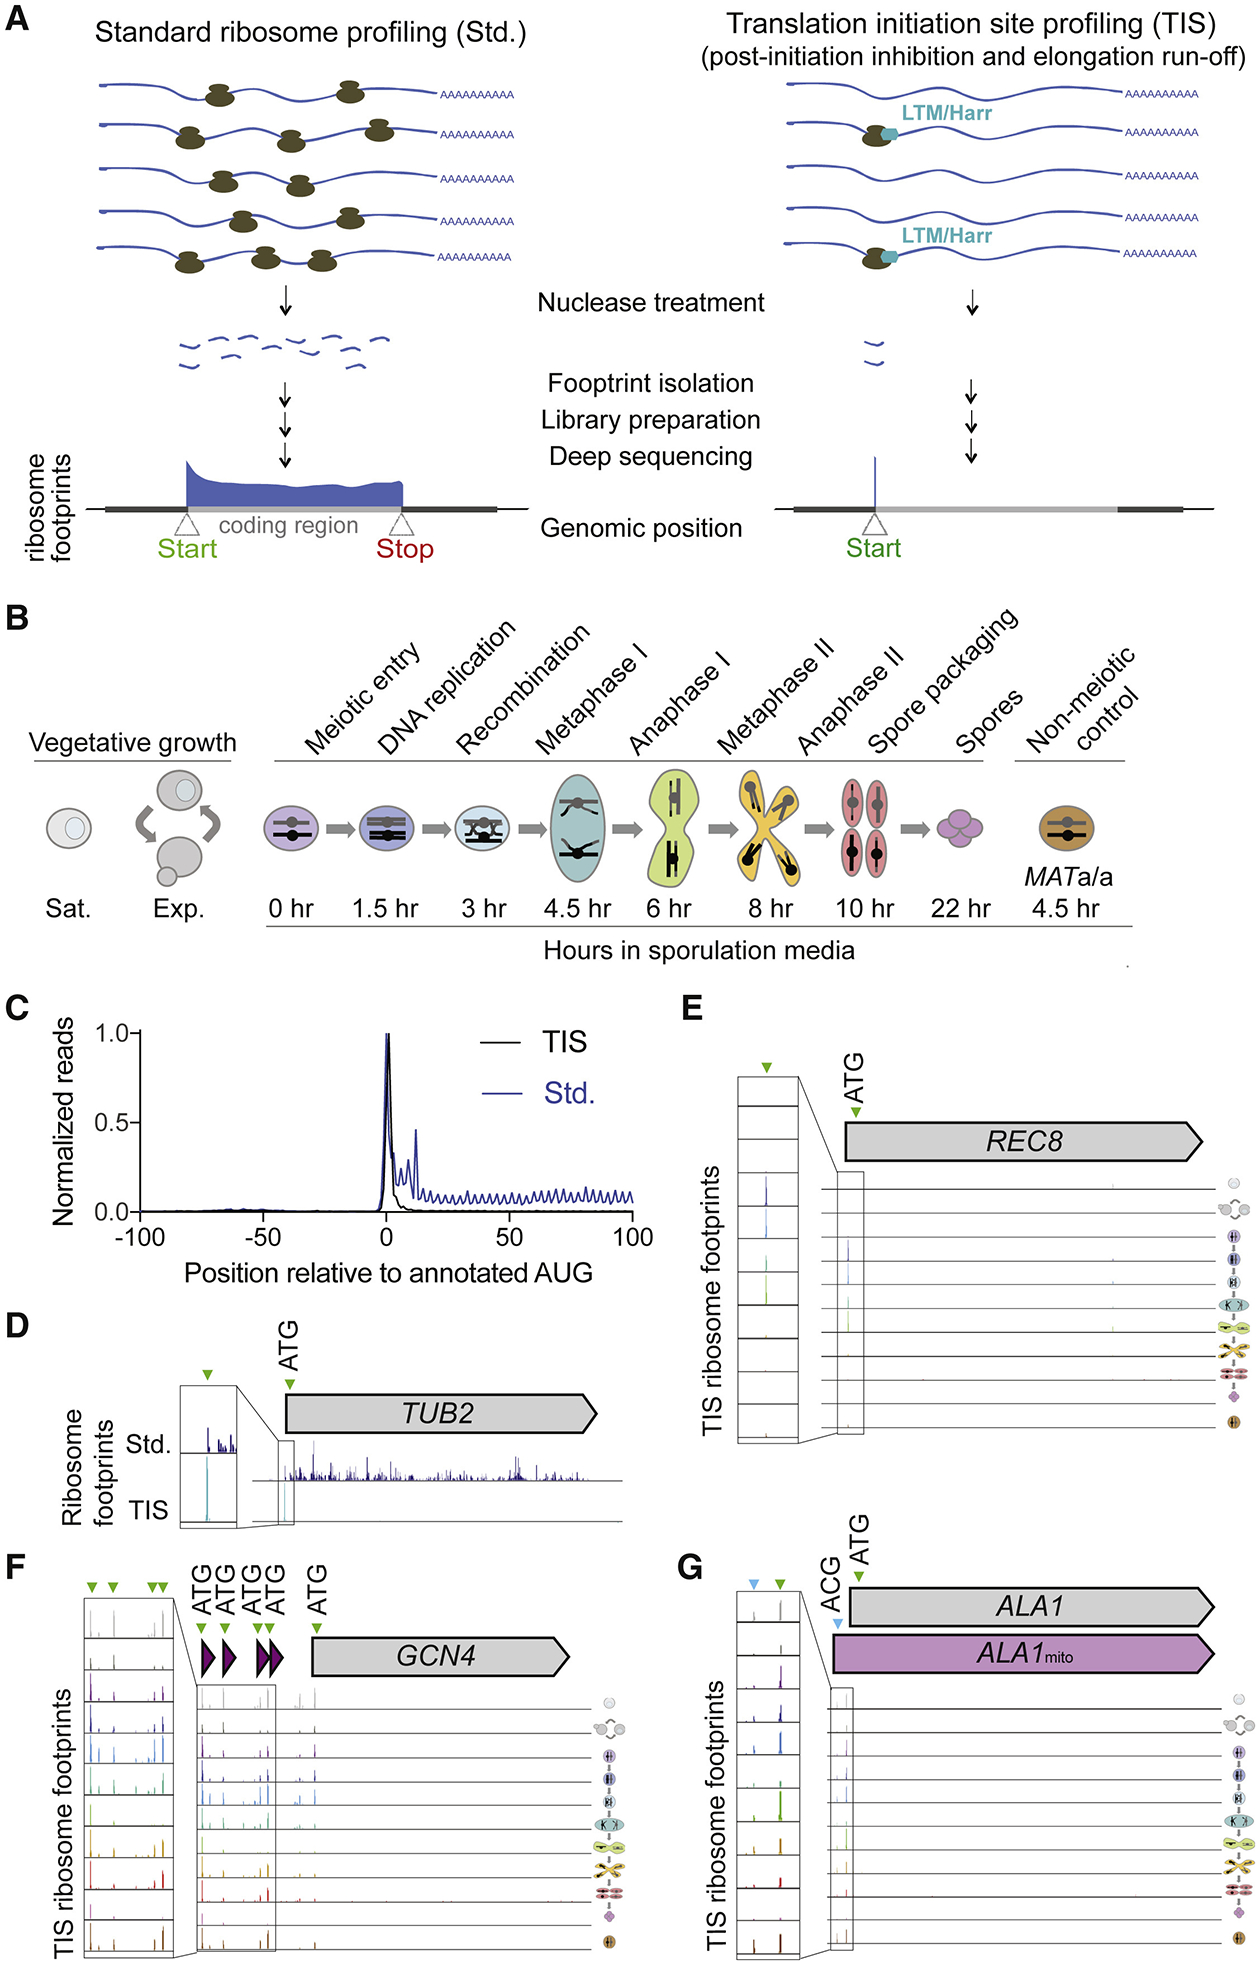
Figure 1: Translation initiation site ribosome profiling in mitotic and meiotic yeast cells.

(A) Cartoon comparing standard (Std., left) and translation initiation site (TIS, right) ribosome profiling, with representative ribosome footprint profiles for a typical ORF.
(B) Schematic of yeast cell stages and samples collected for TIS-profiling, including vegetative saturated (sat.), vegetative exponential (exp.), 0 hr, 1.5 hr, 3 hr, 4.5 hr, 6 hr, 8 hr, 10 hr, and 22 hr after addition to sporulation media, and a MATa/a non-meiotic control taken at 4.5 hr in sporulation media.
(C) Metagene plot of normalized reads from standard ribosome profiling (blue) and TIS-profiling (black), 100 nucleotides upstream and downstream of annotated AUG start codons. Values are normalized to the peak at position zero.
(D) Comparison of standard and TIS-profiling for TUB2, a representative gene, from all timepoints combined. Green arrowheads indicate peaks at ATGs, and inset shows close-up view of region around predicted initiation site.
(E-G) TIS-profiling of REC8 (E), GCN4 (F) and ALA1 (G), showing ribosome footprints at the time points indicated in Figure 1B. Green arrowheads indicate peaks at ATGs, and blue arrowheads indicate non-ATG peaks.
