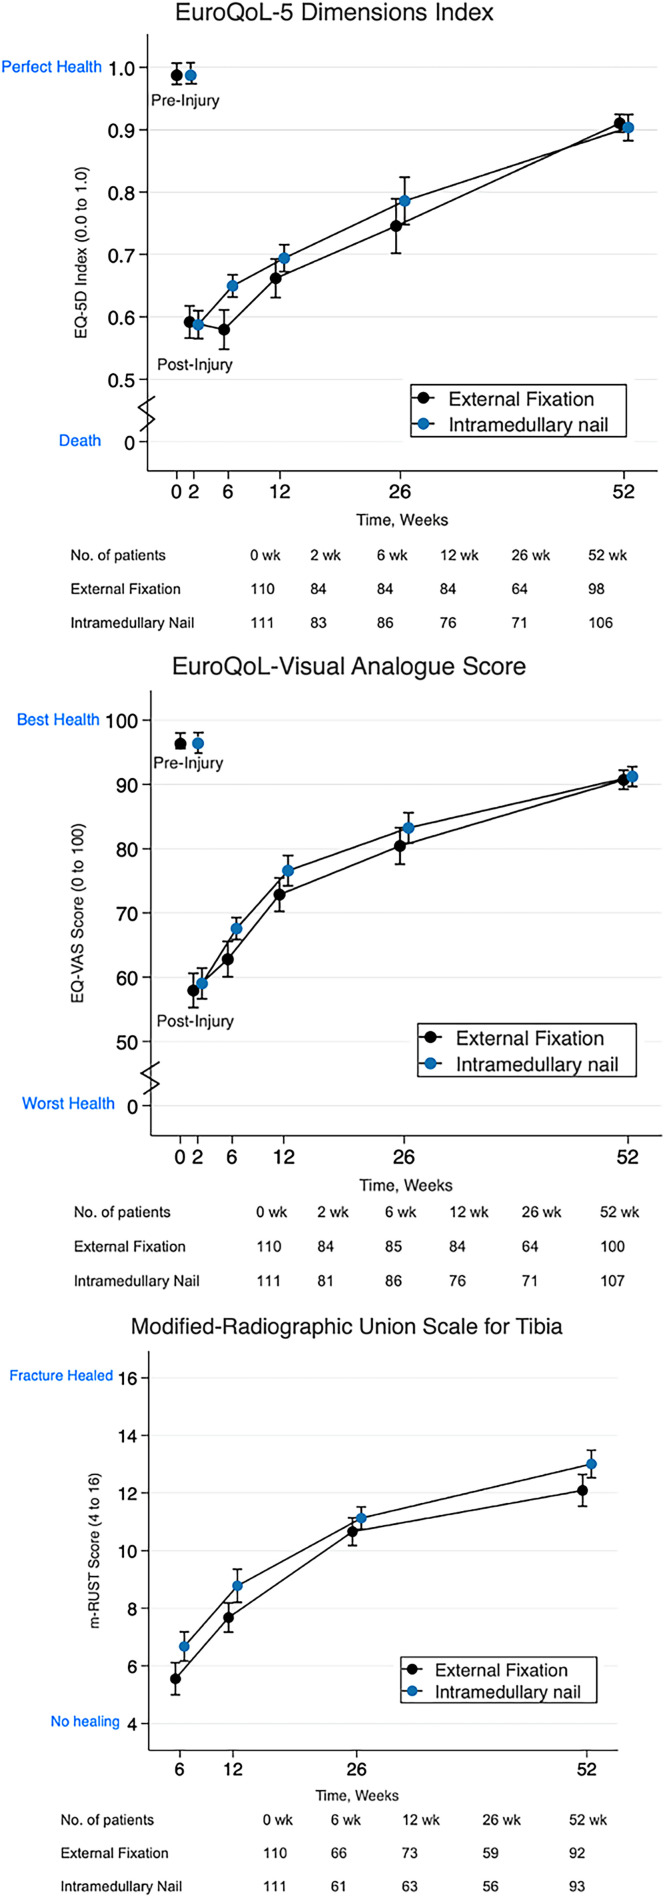
Fig. 2.
Figs. 2-A, 2-B, and 2-C Line graphs showing temporal trends in secondary outcomes by treatment arm. The values are shown as the mean and 95% CI at baseline and each follow-up visit. Fig. 2-A EuroQol-5 Dimensions index. Fig. 2-B EuroQoL visual analog scale score. Fig. 2-C Modified Radiographic Union Scale for Tibial fractures (mRUST).

