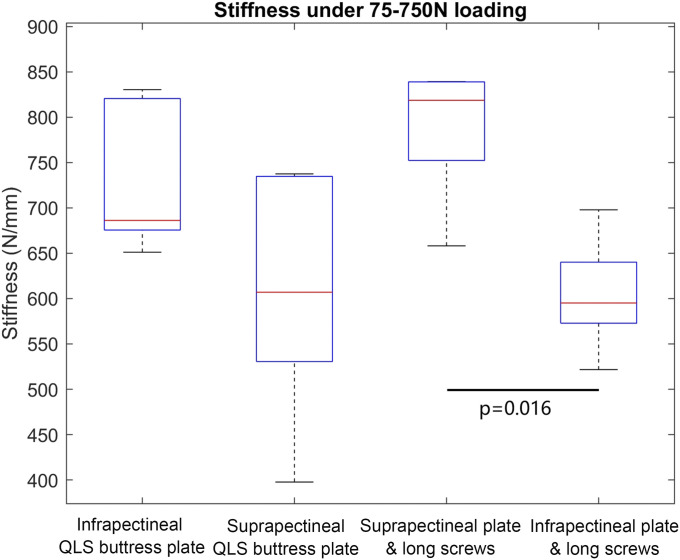
Fig. 6.
Box-and-whisker plots showing the values of axial stiffness in N/mm for the 4 different fixation constructs under the 75 to 750-N loading test. The horizontal red line in each box indicates the median value, the top and bottom borders of the box show the 75th and 25th percentiles, and the whiskers show the 10th and 90th percentiles. The differences with significance are indicated with p values.

