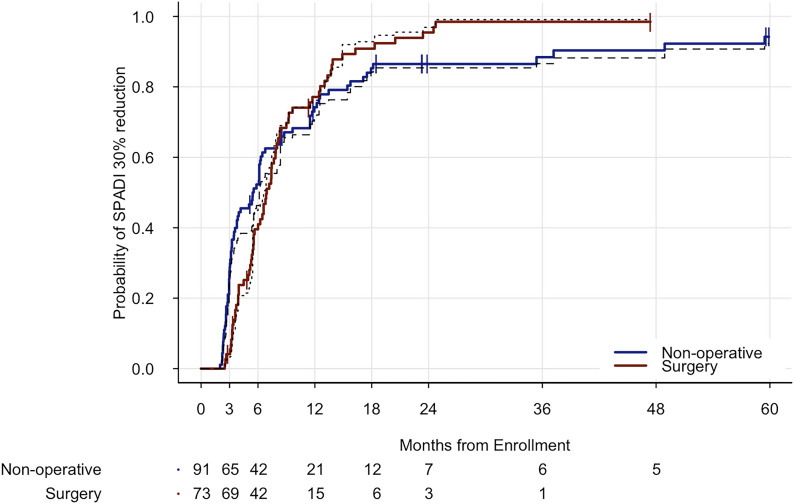
Fig. 3-A.
The cumulative incidence curve for achieving >30% reduction in SPADI scores in the nonoperative treatment group (blue) and the surgical treatment group (red). The dashed lines indicate adjustment after propensity score weighting.
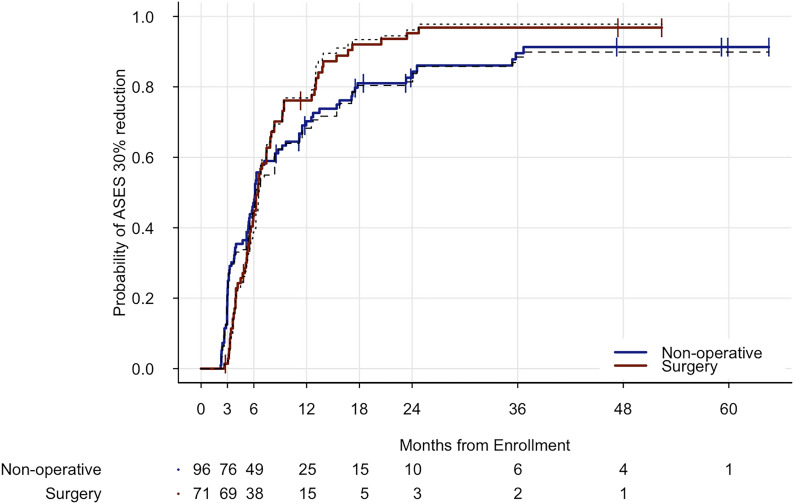
Fig. 3-B.
The cumulative incidence curve for achieving >30% reduction in ASES scores in the nonoperative treatment group (blue) and the surgical treatment group (red). The dashed lines indicate adjustment after propensity score weighting.


