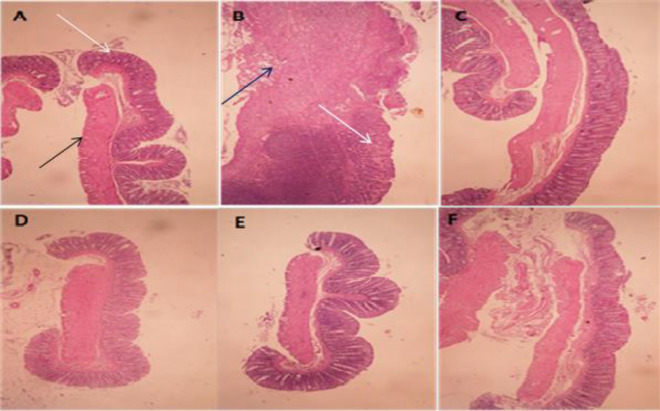
Figure 2.
Microscopic illustration of colonic tissue in rats. (A) Normal tissue, treated with normal saline/tween (5 ml/kg); (B) Colitis control group tissue which shows crypt damage (white arrows), leucocytes infiltration, mucus and sub-mucosal layer edema and inflammation (black arrows); (C) Colitis treated with ACAE (600 mg/kg); (D) Colitis treated with ACHE (300 mg/kg); (E) Colitis treated with prednisolone (4 mg/kg); (F) Colitis treated with mesalazine (100 mg/kg). H&E staining at x10 magnification (panel B was x40 magnified).

