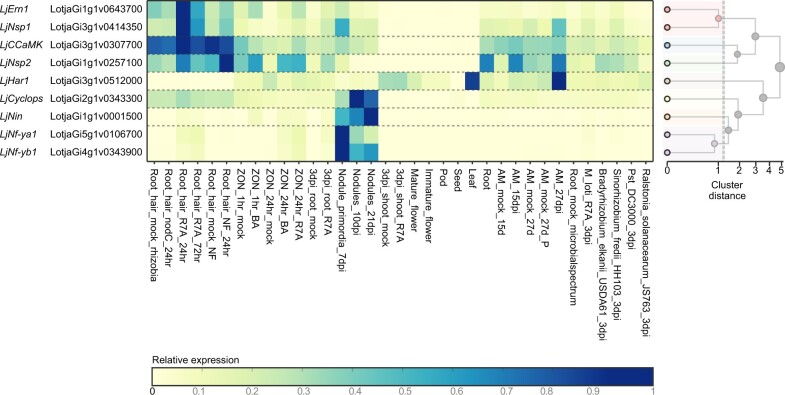
Figure 2.
Expression profiles of known symbiosis genes. Expression values from the Lotus Gifu RNA-seq expression atlas are shown for the indicated genes. A full description of the conditions included is shown in Supplementary Table S1. The heatmap was generated from https://lotus.au.dk/expat/ using the normalize by row function.

