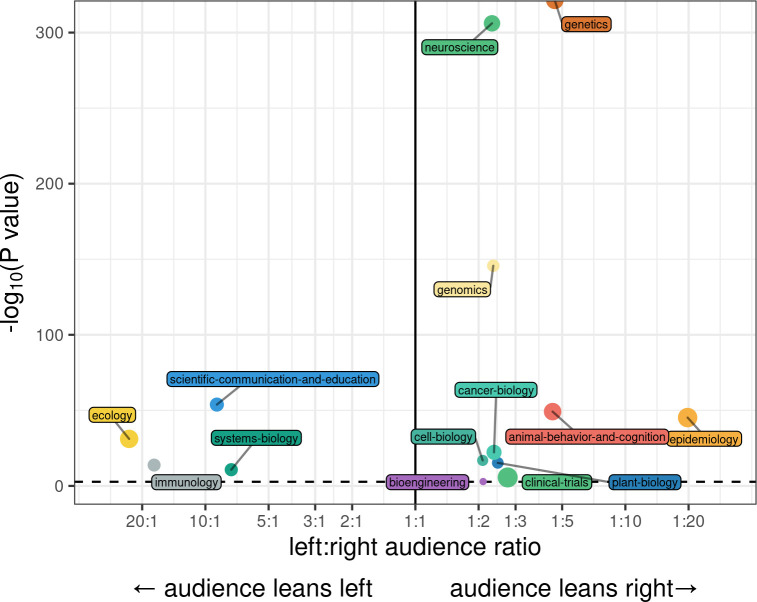
Fig 3. Political skew of nonacademic audience sectors by bioRxiv category.
The x-axis shows the ratio between the estimated sizes of left-wing audience sectors (associated with the hashtag “#resist”) and right-wing audience sectors (associated with the hashtag “#maga”) among all tweets referencing preprints in a given bioRxiv category. Data shown are for the 14 bioRxiv categories where this ratio exceeds 2:1 or 1:2. The y-axis shows the -log10 p-value of a chi-square test for whether the sizes of these audience sectors match an underlying null distribution, assuming 62.5% of users lean left and 37.5% of users lean right, based on a recent poll of US Twitter users’ political ideologies. Preprint categories with statistically significant differences (after Bonferroni multiple testing correction) are annotated above the dashed line. The size of each point indicates the total number of users affiliated with political audience sectors for that category. Data for the information depicted in this figure are available at https://github.com/carjed/audiences.

