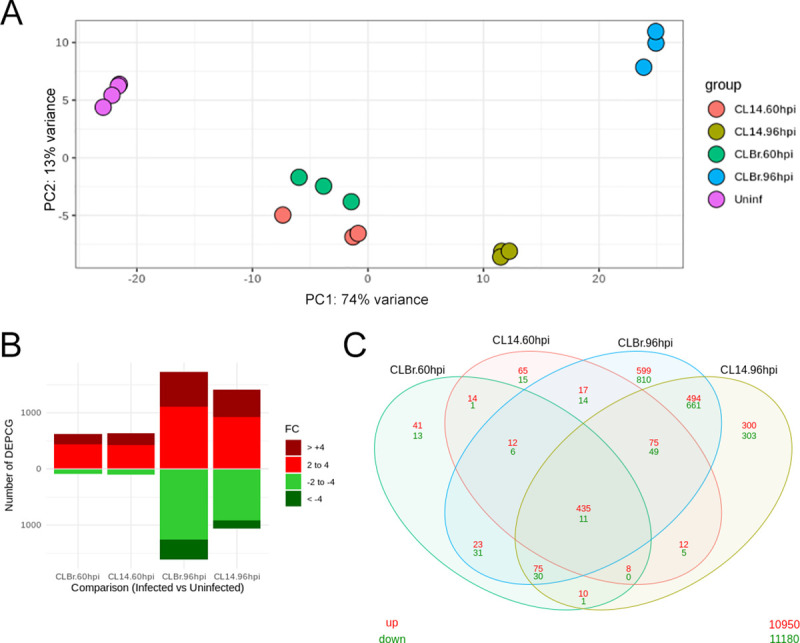
Fig 1. RNA-Seq data analysis and differential gene expression across human cells infected with T. cruzi CL Brener and CL-14.

(A) Principal component analysis (PCA) plot from RNA-Seq data generated from HFF cells mapped to human genome. Each group was represented in different colors. (B) Bar plots of the numbers of protein-coding genes considered significantly differently expressed (adjusted p-value < .05) comparing infected cells vs uninfected samples. The numbers of genes in each category were defined as: fold changes 2–4 (light red for positive, light green for negative) and fold change >4 (dark red for positive and dark green for negative). (C) A Venn diagram analysis displays overlaps of upregulated (red) and downregulated (green) protein-coding genes among the different comparisons performed against infected and uninfected samples.
