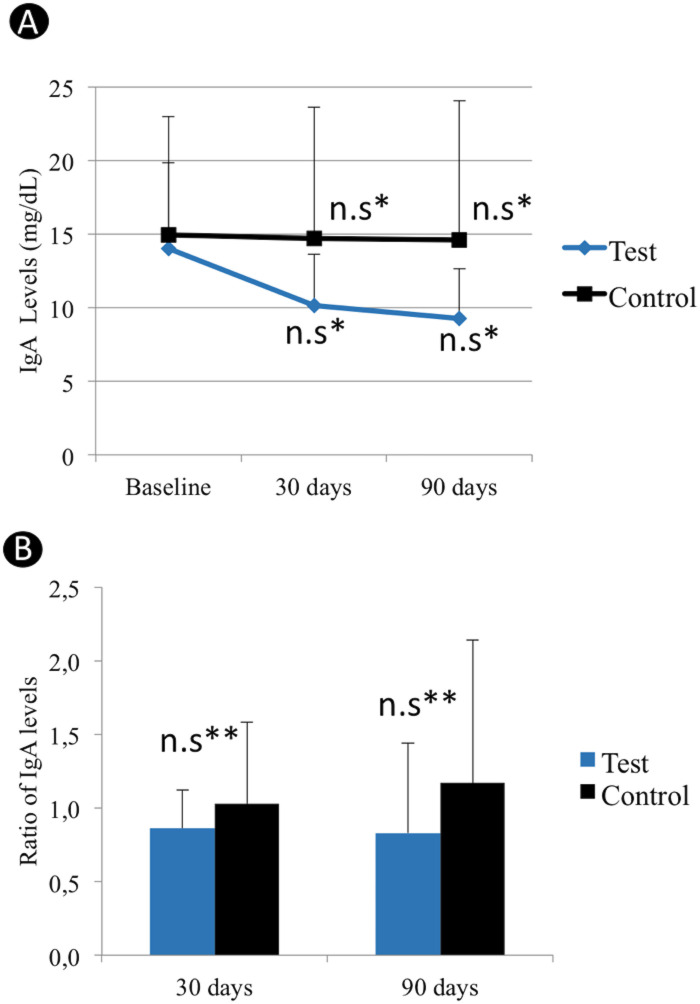
Fig 2.
IgA levels (A) of Test and Control groups at baseline and at 30 and 90 postoperative days. Mean changes in IgA levels relative to baseline values obtained for the Test and Control groups are shown in (B). Ratio of IgA levels = changes in IgA levels in relation to baseline values. n.s* No significant changes were observed in IgA levels at both 30 and 90 days, compared to baseline, for Test and Control groups. n.s** No significant differences between Test and Control groups at both 30 and 90 days.

