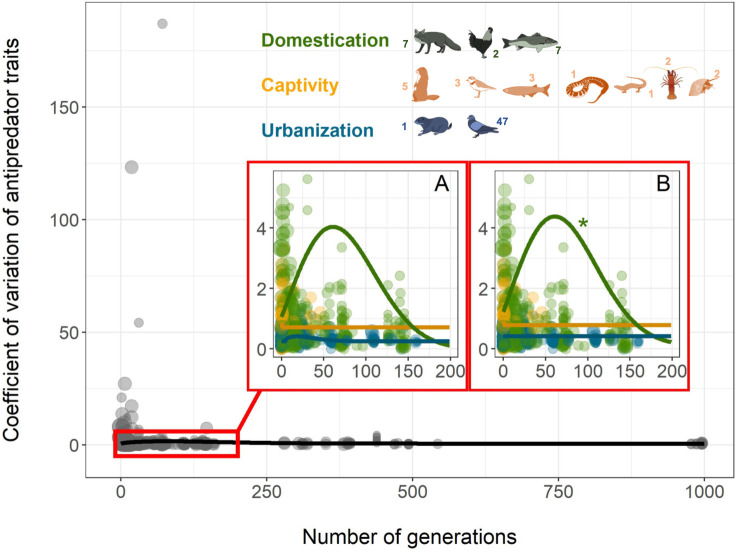
Fig 2. Effects of human presence over time on the CV in antipredator traits, black line (all contexts).
(A) Lines correspond to the best loess fitting the data using the cma-es function. (B) Lines correspond to the best Weibull model with the outputs (slopes and intercepts) of the MCMCglmm for the CV. Dot size is proportional to the log-transformed number of replicates used in each study. “*” indicates significant p-value < 0.05 of the Weibull slopes with the MCMCglmm model (S1 Table). The number associated with each animal indicates the number of species in each of the following taxa: Mammals, Birds, Reptiles, Fish, Amphibians, Arthropods, and Mollusks. All data and R code supporting the figure are available in S1C Data. Species design: Pierre Lopez (MARBEC). cma-es, covariance matrix adapting evolutionary strategy; CV, coefficient of variation; MARBEC, Marine Biodiversity, Exploitation and Conservation; MCMCglmm, Markov chain Monte Carlo generalized linear mixed model.

