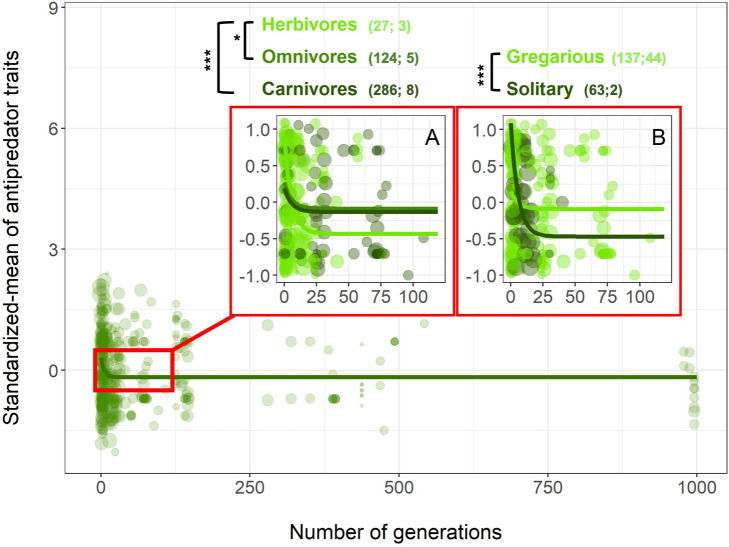
Fig 3.
The decrease in average antipredator traits over generations of domestication differs as a function of animal’s foraging type (A) and social status (B). The lines represent the best inverse model with the outputs (slopes and intercepts) of the MCMCglmm. In (A), model was fitted with foraging type × generation interaction. In (B), model was fitted with social status × generation interaction. Dot size is proportional to the log-transformed number of replicates used in each study. The number in brackets represents the number of estimates followed by the number of species. “*” indicates significant p-value < 0.05 and “***” significant p-value < 0.001 between slopes within each life-history trait using the MCMCglmm model (S3 Table). All data and R code supporting the figure are available in S1C Data. MCMCglmm, Markov chain Monte Carlo generalized linear mixed model.

