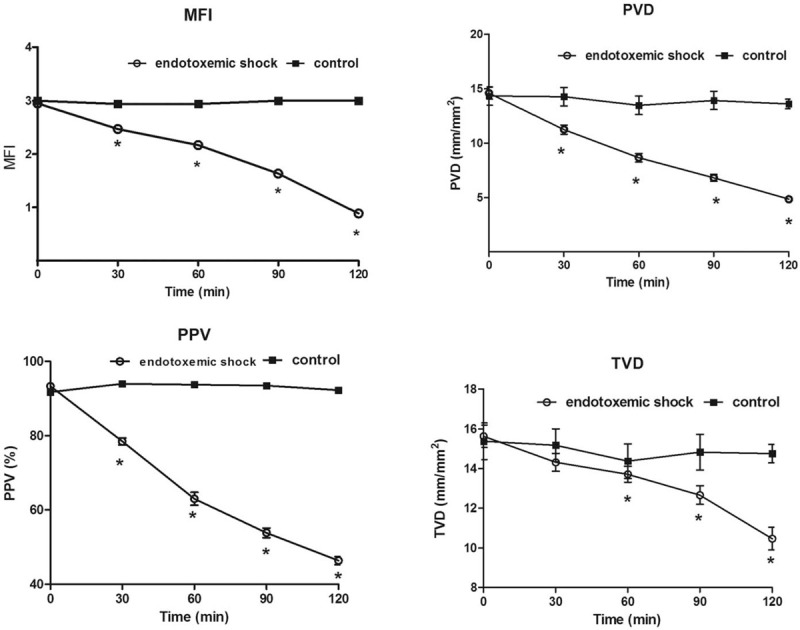
Figure 3.

Changes in microvascular flow index (MFI), proportion of small perfused vessels (PPV), perfused vessel density (PVD), total vessel density (TVD) between 0 and 120 min. Values shown as mean ± standard deviation of all animals at each time point. ∗P < 0.05 vs. baseline.
